
Constellation Software: DCF Valuation
A high-ROIC acquisition compounder priced as if the its engine is slowing. Is it, though? - DCFriday #008

Glad to announce we partnered with TacticzHazel & collaborated on writing this DCF analysis. Thank you Tacticz for coming over to Hated Moats headquarters. :)
Tacticz has an amazing content over at this Substack and we recommend to subscribe to his Substack via the button below.
Let’s dive into valuation of Constellation Software:
Date of Analysis: January 16-23, 2026
Verdict: Undervalued
Current Price Target (Base Case): C$3,642
Price at the Time of Analysing: C$2,713 - C$2,781.11
1. Brief Overview
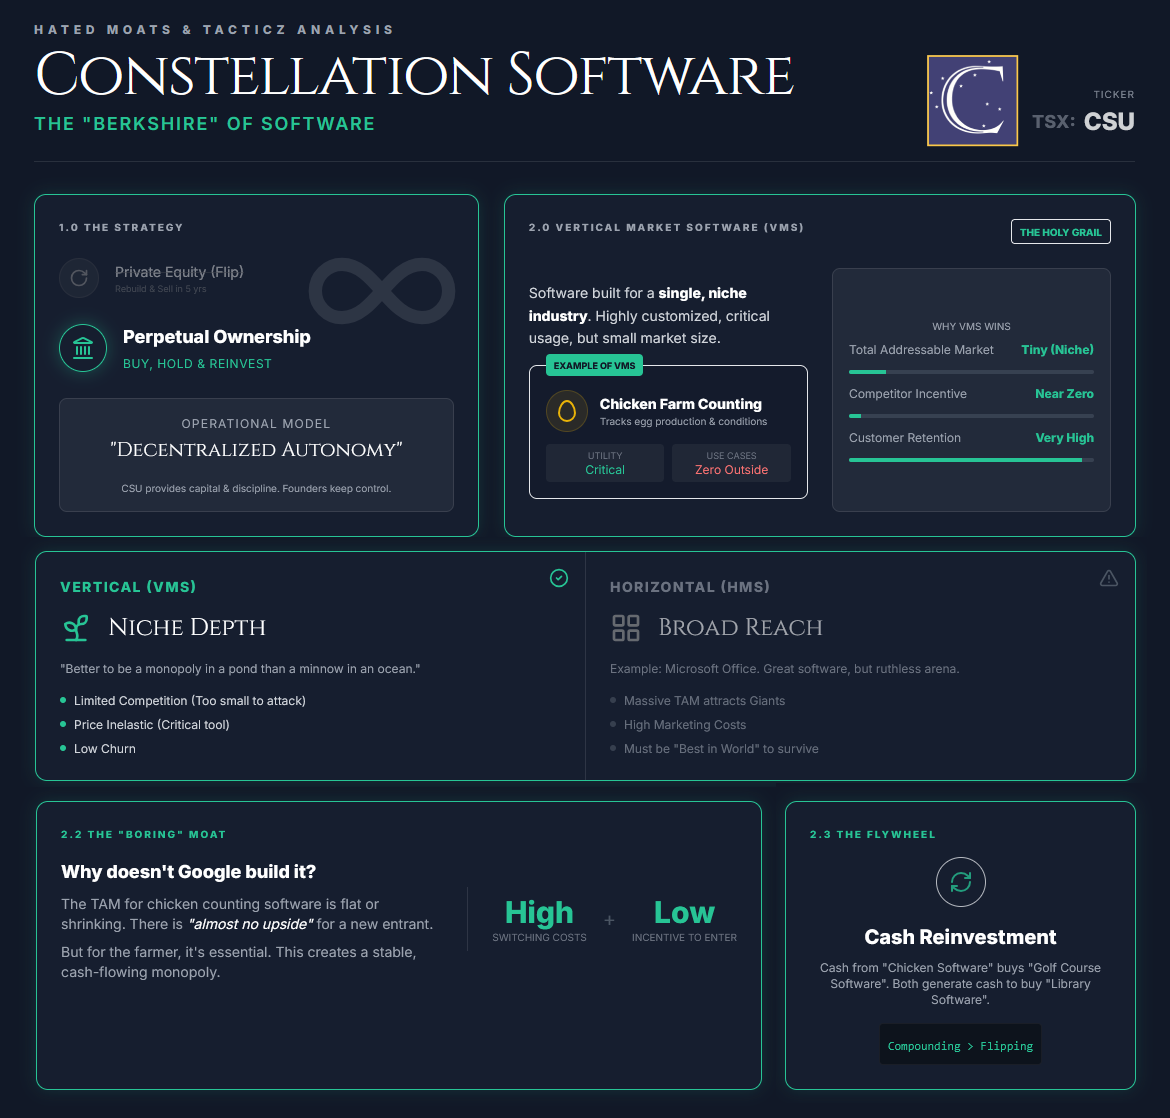
Constellation Software is a so-called ‘‘multi-acquirer’’, often referred to as the “Berkshire Hathaway of software”. The company specializes in buying and managing software businesses that develop vertical market software (VMS).
VMS is software built for a single, niche industry. It tends to be highly customised, serve a small market (small TAM), and face limited competition because there’s little incentive for new entrants to build a “better” version for such a narrow use-case.
An example from one podcast: chicken farm counting system. Think of a system that was specifically built to keep track of which chickens produce the most eggs, and when and under which conditions. There will be absolutely no other use-case for software like this, but it’s critical for chicken farmers to use to optimize their productivity. So, the software is built and used. But since the TAM is so small, there’s really no incentive to really try to launch new, better software. As long as this suffices, everyone is okay. The thing here is, there’s almost no upside. The TAM is not set to explode, but it will stay very flat or maybe rise or fall slightly.
HMS (horizontal market software) is the exact same opposite: that’s software that is designed for many different industries and sectors. Maybe the best example might be Microsoft’s Office software. That’s so broad and generic (but good), that it can be used in almost any company in the world. So, general-purpose build, widely applicable and high level of flexibility. The complete opposite of VMS.
So how does CSU’s strategy work?
Constellation runs a “buy and hold” model. It acquires established, often niche VMS businesses that provide essential software and intends to own them long-term. Unlike private equity, CSU isn’t buying to “flip”. Post-acquisition, subsidiaries typically keep high autonomy. CSU provides capital, discipline, and shared best practices while staying out of day-to-day operations.
Crucially, CSU doesn’t come in to replace management or “rebuild” the business. That stability is part of the appeal for founders. CSU then reinvests the cash flows these businesses generate into acquiring the next set of companies, compounding the model over time in this fashion.
2. Discounted Cash Flow (DCF): Assumptions & Methodology
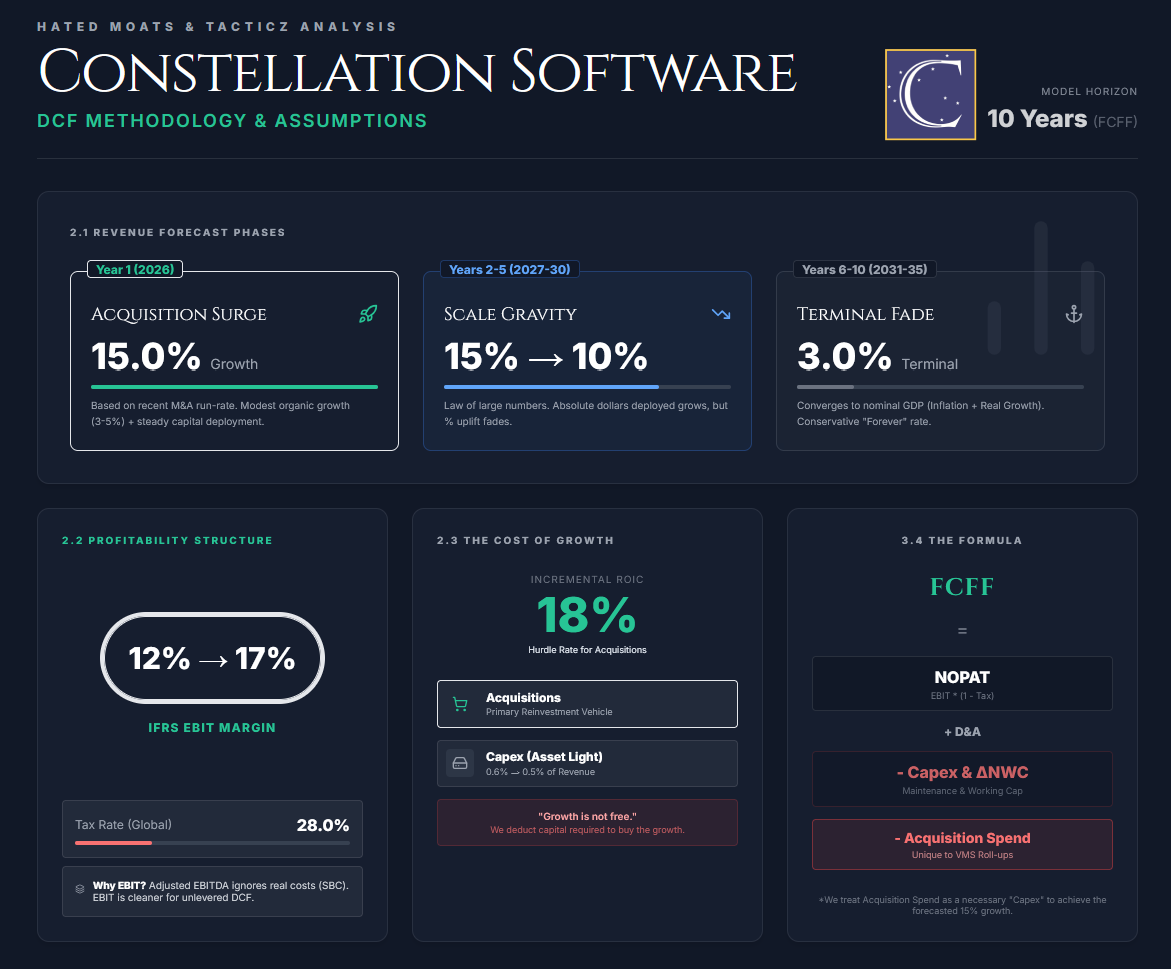
We value CSU using a 10-year Free Cash Flow to the Firm (FCFF).
2.1 Revenue Forecast (Years 1-10)
Year 1 (2026) Growth: 15.0%
We base 2026 on Constellation’s recent operating trajectory and the arithmetic of its acquisition-led compounding model. For 9M 2025, revenue was up 15% year over year (16% in Q3), driven primarily by acquisitions; organic growth was 3% for the first nine months and 5% in Q3. We therefore model 2026 revenue growth of 15%, which is consistent with the current mid-teens run-rate and broadly in line with published consensus expectations. This assumes a steady acquisition cadence alongside modest organic growth (renewals, pricing, and incremental upsell), without embedding a step-change in either deployment intensity or organic demand.
Years 2-5 (2027-2030): Decelerating from 15% to 10%
As the revenue base scales, we assume Constellation’s reported growth rate moderates gradually, while the company remains fundamentally acquisition-led. The core mechanic is arithmetic. Even if CSU continues to deploy substantial absolute dollars into acquisitions, each incremental deal represents a smaller percentage uplift on a larger starting base. Organic growth in vertical market software is typically low-to-mid single digits (supported by renewals, modest price increases, and incremental module adoption), so the primary driver of year-to-year variability in reported growth remains the pace and timing of M&A deployment.
We assume pricing and contract renewals remain resilient (we embed a 2–3% price uplift in the base), while the acquisition contribution tapers modestly as the business scales and deployment becomes incrementally harder at unchanged hurdle rates. This results in a base-case deceleration that remains consistent with CSU’s historical compounding profile, without assuming an abrupt slowdown:
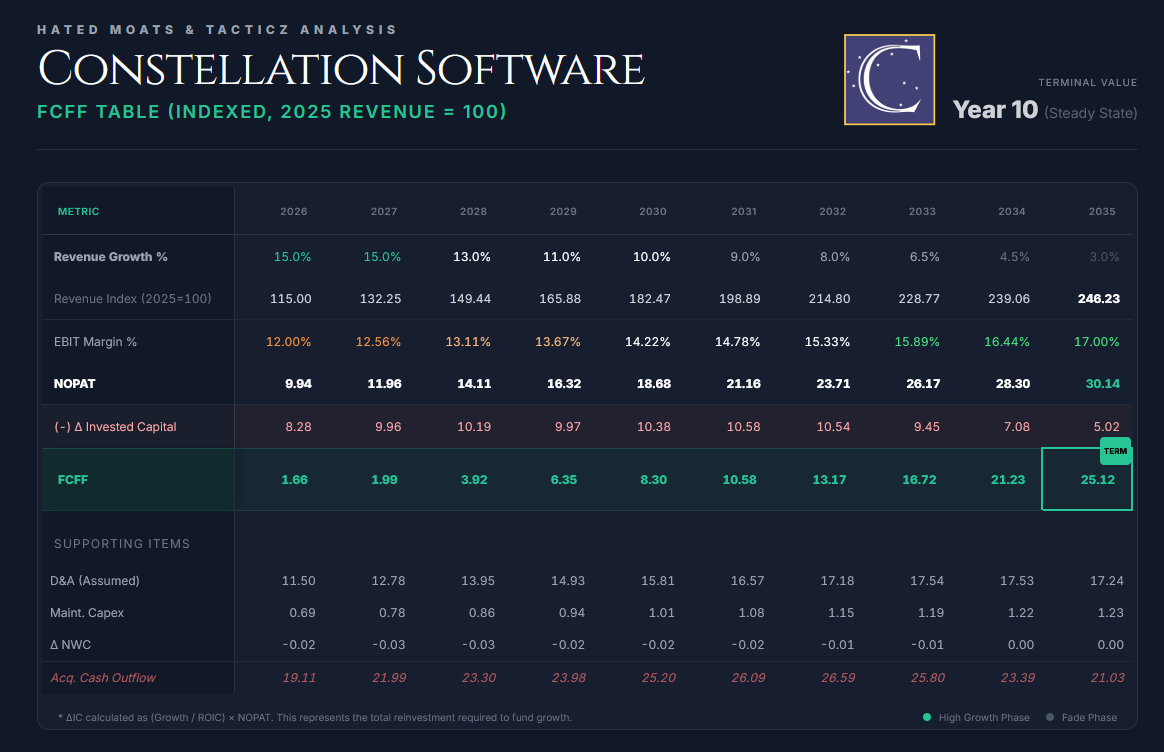
2027E: 15.0%
2028E: 13.0%
2029E: 11.0%
2030E: 10.0%
Years 6-10 (2031-2035): Fading to 3.0% terminal growth rate
Beyond 2030, we assume further normalisation toward a mature, long-run growth rate broadly in line with nominal GDP (2% inflation and 1% real growth). This reflects:
a) the stickiness of mission-critical vertical market software and renewal economics,
b) ongoing tuck-in acquisition activity that continues in absolute dollars but becomes a smaller percentage contributor as the base scales, and
c) the diminishing percentage uplift from M&A as Constellation grows larger.
We deliberately avoid assuming a structural re-acceleration in organic growth. Instead, the model remains anchored in CSU’s acquisition-led compounding playbook while acknowledging the “law of large numbers” inherent in forecasting over a long horizon.
We fade reported revenue growth as follows:
2031E: 9.0%
2032E: 8.0%
2033E: 6.5%
2034E: 4.5%
2035E: 3.0% (terminal growth rate)
This trajectory implies a high to mid-single-digit long-run growth profile fading to a 3% nominal terminal rate, intentionally conservative relative to CSU’s historical acquisition-fuelled compounding, without assuming the acquisition engine stops.
2.2 Profitability (EBITDA → NOPAT)
For valuation purposes, we anchor profitability on IFRS operating profit (EBIT) rather than Adjusted EBITDA. Adjusted metrics often exclude recurring, economically real costs (most notably stock-based compensation), and can understate the true cost base borne by shareholders. By using operating EBIT (defined as profit generated from operations before financing and taxes), we align the model with an unlevered DCF framework and ensure NOPAT is derived from a clean, capital-structure-neutral operating profit measure. We forecast EBIT margins broadly in line with Constellation’s historical profitability, while allowing for gradual operating leverage as the platform scales.
Start EBIT Margin: 12.0% in Year 1
Constellation’s operating profitability under IFRS has historically sat in the low-to-mid teens on a post-acquisition, post-amortisation basis. We assume a 12% EBIT margin in 2026E, reflecting modest operating leverage but also the dilutive effect of acquisition mix, integration costs, and acquisition accounting (including amortisation and earn-out related noise). This is consistent with a recent run-rate in the low-teens, with Q3 2025 implying roughly 10-11% on an EBIT-proxy basis, and therefore represents modest normalisation rather than a step-change in profitability.
Long-Run Margin Path: Gradually expands to 17% by Year 10
As Constellation scales, the model benefits from incremental operating leverage (shared infrastructure, procurement/overhead discipline, and a growing mix of recurring maintenance and subscription-like revenues), supporting gradual margin expansion over time. We conservatively cap long-run EBIT at 17% by Year 10 (below best-in-class pure-play software peers) to reflect CSU’s ongoing acquisition cadence, decentralised operating model, and the persistent drag from integration friction and amortisation of acquired intangibles. This is consistent with Constellation’s long-standing capital allocation discipline (deploying incremental capital where expected returns exceed the cost of capital), which supports sustained cash compounding without requiring heroic assumptions on organic acceleration.
Tax Rate: 28.0% (normalised)
We apply a normalised effective tax rate of 28%, intended to approximate Constellation’s blended global tax profile across its jurisdictions. Reported effective tax rates can be volatile due to acquisition accounting, fair value adjustments, and jurisdictional mix. For example, the effective tax rate on continuing operations in Q3 2025 was roughly 32% (and 38% for 9M 2025). We therefore use a stable, normalised rate for the forecast period rather than extrapolating quarter-to-quarter fluctuations.
NOPAT Calculation
NOPAT = EBIT x (1 - Tax Rate)
2.3 Reinvestment & ROIC
Constellation is structurally asset-light. Most “reinvestment” is executed through acquisitions (capital deployment into purchased VMS businesses) rather than heavy internal capex. That said, maintenance capex and working-capital dynamics still matter for FCFF and are explicitly modelled.
Capex
We model cash capex (property and equipment purchased) at 0.6% of revenue in the near term, fading modestly toward 0.5% in the terminal year. This is anchored in CSU’s disclosed ‘property and equipment purchased’ figures (e.g., $16m in Q3 2025 on $2,948m revenue, i.e. 0.54%, and $47m in 9M 2025 on $8,446m revenue, i.e. 0.56%).
Net Working Capital (NWC)
Constellation’s working-capital profile is typically favourable (maintenance billings/deferred revenue can make NWC structurally light/negative), but the change in working capital has been close to neutral in aggregate. In 9M 2025, management disclosed non-cash working capital impact of ~$2m (immaterial). Accordingly, we model a small working-capital benefit in the near term (ΔNWC = −0.1% to −0.2% of incremental revenue), fading to 0% by the terminal period.
ROIC (Return on Invested Capital)
Constellation’s economic engine is best understood as a capital allocator. Management defines FCFA2S and has stated that, while FCFA2S could be returned via dividends or repurchases, the objective is to invest it into acquisitions that meet a hurdle rate. Because our revenue forecast embeds acquisition-led growth, we explicitly reflect the associated reinvestment requirement (net cash deployed into acquisitions/holdbacks less cash acquired) rather than assuming acquired cash flows arrive “for free.”
For modelling clarity, we anchor on an incremental ROIC of 18% for the acquisition reinvestment engine (base case). This is the ROIC used to translate growth into required reinvestment.
3.4 Free Cash Flow to the Firm (FCFF)
We model unlevered free cash flow using an acquisition-consistent FCFF framework:
FCFF = NOPAT + D&A − Maintenance Capex − ΔNWC − Acquisition Reinvestment,
where NOPAT = EBIT × (1 − Tax Rate).
Because our revenue forecast embeds acquisition-led growth, we include an acquisition reinvestment charge (net cash deployed into deals/holdbacks less cash acquired) so incremental acquired cash flows are not assumed to arrive “for free.”
ROIC-based implementation (reconciliation): under an ROIC framework, the incremental invested capital required to support growth is approximated as:
ΔIC = (g / ROIC) × NOPAT, where ROIC is an incremental ROIC on deployed acquisition capital (we use 18% as the base case).
To stay consistent with the cash-flow bridge above, we translate this into gross reinvestment (cash investment) by adding back the non-cash offset:
Gross Reinvestment = ΔIC + D&A = (g / ROIC) × NOPAT + D&A.
Accordingly, the implied net acquisition reinvestment cash outflow is computed as the residual after maintenance reinvestment:
Acquisition Reinvestment = (g / ROIC) × NOPAT + D&A − Maintenance Capex − ΔNWC.
This formulation preserves the standard FCFF identity while ensuring acquisition-led growth carries an explicit reinvestment cost, preventing overstatement of intrinsic value.
3.5 Discount Rate (WACC)
The Weighted Average Cost of Capital (WACC) serves as the hurdle rate for our cash flows. We construct this using market-based inputs current as of January 22-23, 2026.
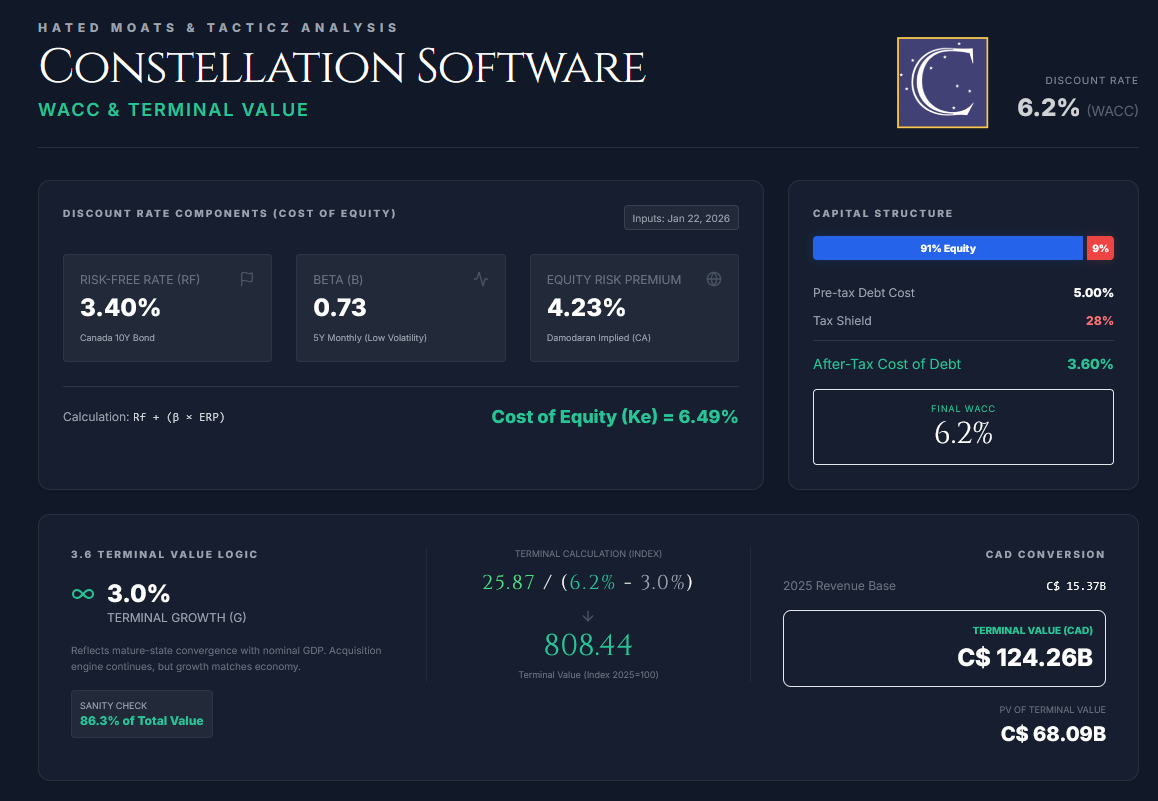
Risk-Free Rate (Rf): 3.40% (yield on the Canada 10-Year Government Bond as of Jan 22, 2026)
Equity Risk Premium (ERP): 4.23% (Damodaran’s implied ERP estimate for Canada, January 2026)
Beta (β): 0.73. (5-year beta, reflecting CSU’s relatively low volatility on TSX).
Cost of Equity (Ke):
Ke = Rf + β x ERP
Ke = 3.40% + 0.73 x 4.23%
Ke = 6.49%
Pre-Tax Cost of Debt (Kd): 5.00%
Tax Shield: 28%
After-Tax Cost of Debt:
Kd (1 - t) = 5.00% x (1 - 0.28) = 3.6%
Capital Structure:
Share price (Jan 22, 2026 close): C$2,713.02
Shares outstanding: 21,191,530
Equity value (market cap): 2,713.02 (Jan 22, 2026 close) × 21,191,530 = C$57.49B
Total debt (Sep 30 2025): $3.985B USD
USD/CAD spot (Jan 22, 2026): 1.378Debt in CAD = 3.985B x 1.378 = C$5.49B
Weights (gross debt):
Equity weight (E): 91.3%
Debt weight (D): 8.7%
(Note: We use gross interest-bearing debt for WACC weights. Although CSU holds substantial cash (Sep 30, 2025: $2.77B), we treat this as operating/deployment liquidity given the firm’s acquisition-led model rather than permanent excess cash. For completeness, using net debt weights would increase the equity weight and reduce WACC modestly which we consider a second-order sensitivity).
WACC Calculation
WACC = (E/V x Ke) + (D/V x Kd x (1 − t))
WACC = (0.913 × 6.49%) + (0.087 × 3.6%) = 5.93% + 0.31% = 6.24, rounded to:
WACC = 6.2%
3.6 Terminal Value
We estimate Terminal Value (TV) using the Perpetuity Growth Method, assuming the business continues indefinitely as a going concern.
Terminal Growth Rate (g): 3.0%
We set terminal growth at 3.0%, modestly below (or at the low end of) long-run nominal GDP growth expectations, reflecting a mature-state scenario where CSU’s growth converges toward broad nominal economic growth (pricing + steady renewal economics), without assuming the acquisition engine stops.
Formula used: TV = FCFF (n+1) / (WACC - g)
The calculation is as follows:
FCFF(Y11) = FCFF(Y10) x (1 + g) = 25.12 x 1.03 = 25.87
then
TV_2035 = 25.87 / (0.062 - 0.03) = 808.44 (index)
Discounting at WACC = 6.2%:
PV of explicit 10-year FCFF (Years 1–10): 70.21 (index)
PV of terminal value:
PV(TV) = 808.44 / (1.062)^10 = 443.00 (index)Terminal value share of total PV:
443.00 / (443.00 + 70.21) = 86.3%
Sanity check: 85-90% terminal contribution is typical for long-duration compounders under a perpetuity-growth DCF (most value sits beyond the explicit forecast window).
Converting to CAD
Since our FCFF table is indexed (2025 revenue = 100), we convert to currency using our chosen revenue base:
TV_2035(CAD) = TV_index x (Revenue_2025(CAD) / 100)
(note: revenue for 2025 is assumed as LTM revenue to Sep 30, 2025 proxied as 9M 2025 + Q4 2024, then converted at spot FX. i.e. 15.37B)
TV_2035 (CAD) = 808.44 × (15.37 / 100) = 808.44 × 0.1537 = C$124.26B
then
Present value of Terminal Value in CAD:
PV(TV) (CAD) = 443.00 × (15.37 / 100) = 443.00 × 0.1537 = C$68.09B
4. Results
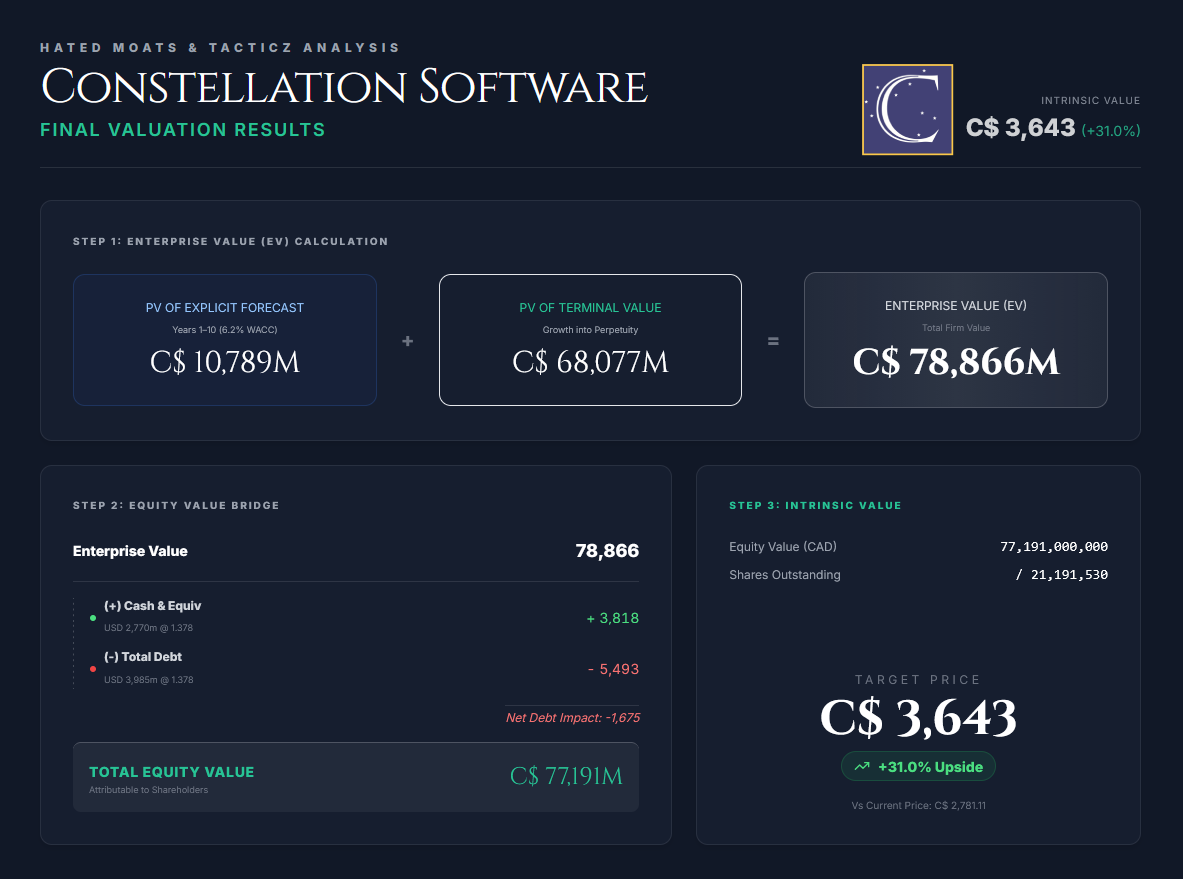
We sum the present value (PV) of the explicit forecast-period cash flows and the PV of the terminal value to arrive at Enterprise Value.
PV of FCFF (Years 1–10)
Discounting Years 1–10 FCFF and the Terminal Value at 6.2% yields:
PV(FCFF Years 1–10): C$10,789M (= 70.21 × C$15.367B / 100)
PV(Terminal Value): C$68,077M (= 443.00 × C$15.367B / 100)
EV: C$78,866M (= PV(FCFF) + PV(TV))
From EV, we bridge to equity value using non-operating items:
+ Cash & cash equivalents:
CSU reported cash = $2,770m (USD) at Sep 30, 2025.
Converted at USD/CAD = 1.378, i.e. C$3,818M.
– Debt:
CSU reported “Bank debt, loans, bonds and debentures” = $3,985m (USD) at Sep 30, 2025.
Converted at USD/CAD = 1.378, i.e. C$5,493M.
Equity Value = 78,866 + 3,818 − 5,493 = C$77,191M
Shares outstanding: 21,191,530
Intrinsic Value per Share
Value per share = 77,191,000,000 / 21,191,530 = C$3,643
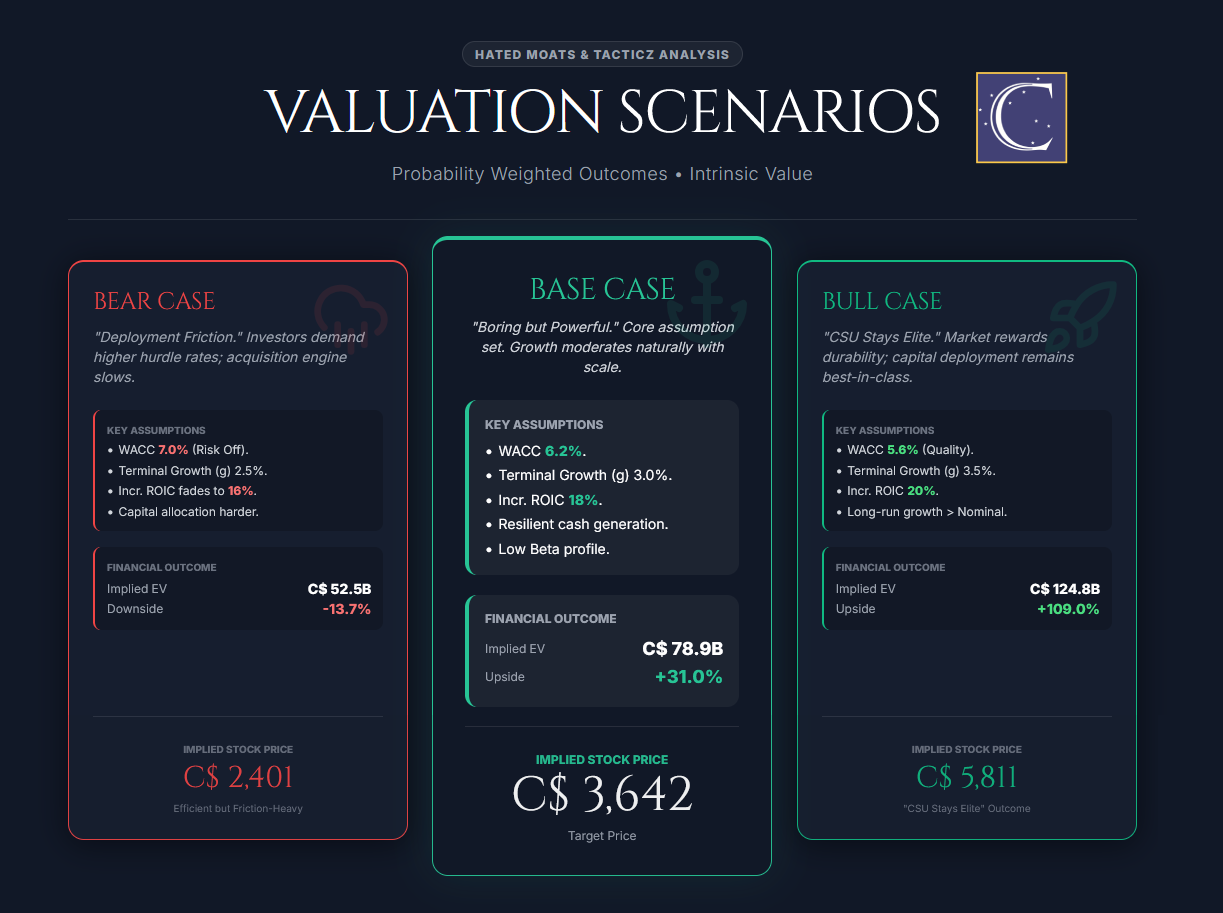
Scenarios
Bear Case: C$2,401 / share
Inputs:
We keep the same operating forecast, but assume a tougher capital allocation and discount-rate regime: WACC = 7.0%, terminal g = 2.5%, and incremental ROIC = 16%. Mechanically, a lower ROIC increases the reinvestment required to hit the same growth path, compressing near-term FCFF. A higher WACC and lower terminal growth further haircut the long-duration component.
Outcome:
Enterprise value falls to C$52.5B and equity value to C$50.9B, implying C$2,401/share. This corresponds to a “deployment friction” world. CSU still compounds, but investors demand a higher hurdle rate and the acquisition engine is less efficient on the margin.
Base Case: C$3,642/share
As modelled above (WACC 6.2%, terminal g 3.0%, incremental ROIC = 18%). This is our core assumption set. CSU remains a high-quality acquirer, but growth naturally moderates with scale. The terminal growth rate converges toward long-run nominal growth and the discount rate reflects CSU’s relatively low beta and resilient cash generation.
Outcome:
This results in over +30% upside to the current price of C$2,781.11.
Bull Case: C$5,811/share
Inputs:
We assume CSU sustains best-in-class deployment and the market rewards the durability, i.e. WACC = 5.6%, terminal g = 3.5%, and incremental ROIC = 20%. Higher ROIC reduces the reinvestment drag (more FCFF for a given growth path), while lower WACC and a slightly higher terminal growth rate meaningfully expand the PV of long-run cash flows.
Outcome:
EV is C$124.8B, equity value is C$123.1B, which is implying C$5,811/share. This is the “CSU stays elite” outcome. Capital deployment remains highly efficient, the market assigns a lower risk premium, and long-run growth converges a bit above nominal baseline.
This result offers over +100% upside from the current price of C$2,781.11.
5. Conclusion: Margin of Safety & Final Verdict
Margin of Safety = 1 – (Current Price / Intrinsic Value)
Margin of Safety = 1 – (C$2,781.11/ C$3,643) = 23.365% (rounded to 23.7%)
On our defined scale, a 23.7% margin of safety places CSU in the undervalued category.
Final verdict: Undervalued (Intrinsic Value = C$3,643)
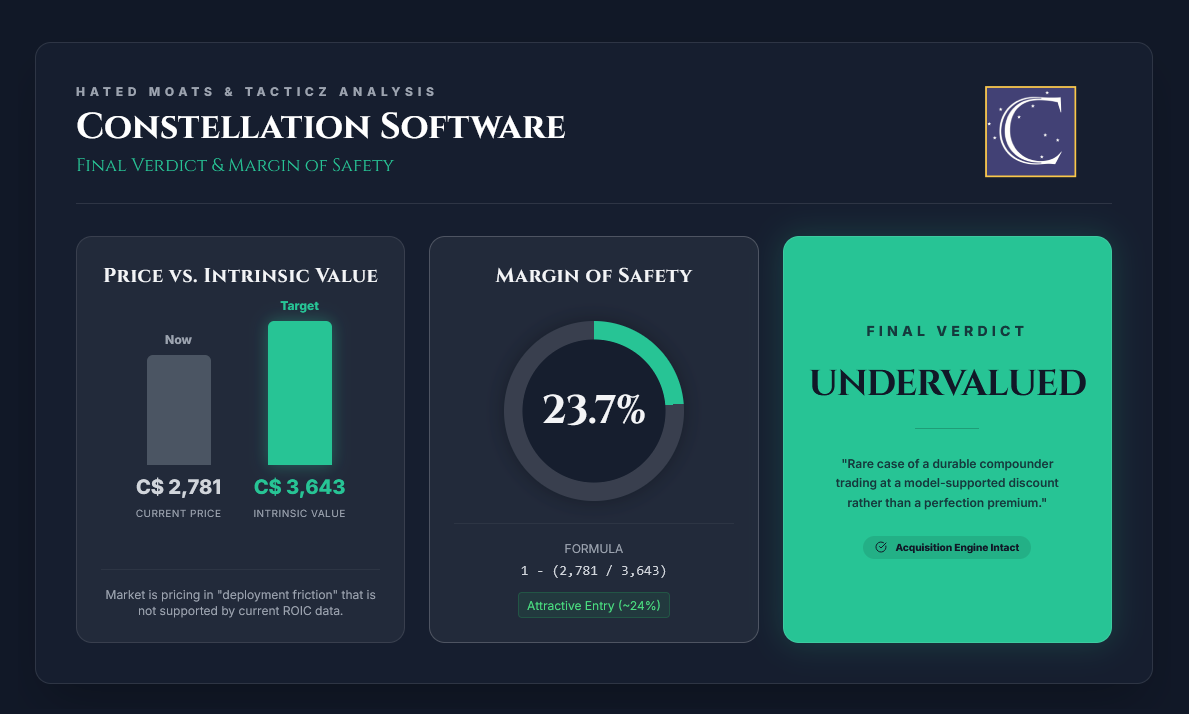
At C$2,713, CSU is priced as if the acquisition engine faces materially more “deployment friction” than our base case, i.e. either a higher required return (WACC), a lower long-run growth runway, or modestly weaker incremental ROIC. Our model explicitly charges acquisition reinvestment (so we are not getting acquired cash flows “for free”), yet the implied value still sits meaningfully above the market price. That is the key point here. Even after paying for growth, CSU screens attractive.
The risk is not near-term earnings volatility but rather the capital allocation economics at scale. The question is whether CSU can continue compounding at high incremental returns as the base grows. As it stands, we view CSU as a rare case of a durable compounding machine trading at a real, model-supported discount rather than at a perfection premium.
Disclosure
The author of this report holds a position in the security of Constellation Software Inc. at C$3,010.11 per share. CSU is also part of our Hated Moats Portfolio at C$2,978.81. This report is for informational purposes only and does not constitute investment advice or a recommendation to buy or sell any security.
We would really appreciate it if you find some time to like, comment, and restack this post.
This tells Substack to show it to more investors and helps us immensely!
Thank you!
What are your thoughts on CSU? Are you buying now? Do you hold the company?
Let us know in the comments!
 | A guest post by
|
Really enjoyed this and appreciate the level of detail you went into. I have been on the cusp of investing into this business for a while and this is helpful knowledge to have. Thanks!
DCF , Salesforce