
dLocal (DLO): DCF Valuation
If This Isn’t Undervalued, What Is? - DCFriday #003

Date of Analysis: November 5-7, 2025
Verdict: Undervalued
Current Price Target (Base Case): $22.49
Price at the Time of Analysing: $13.38
1. Brief Overview
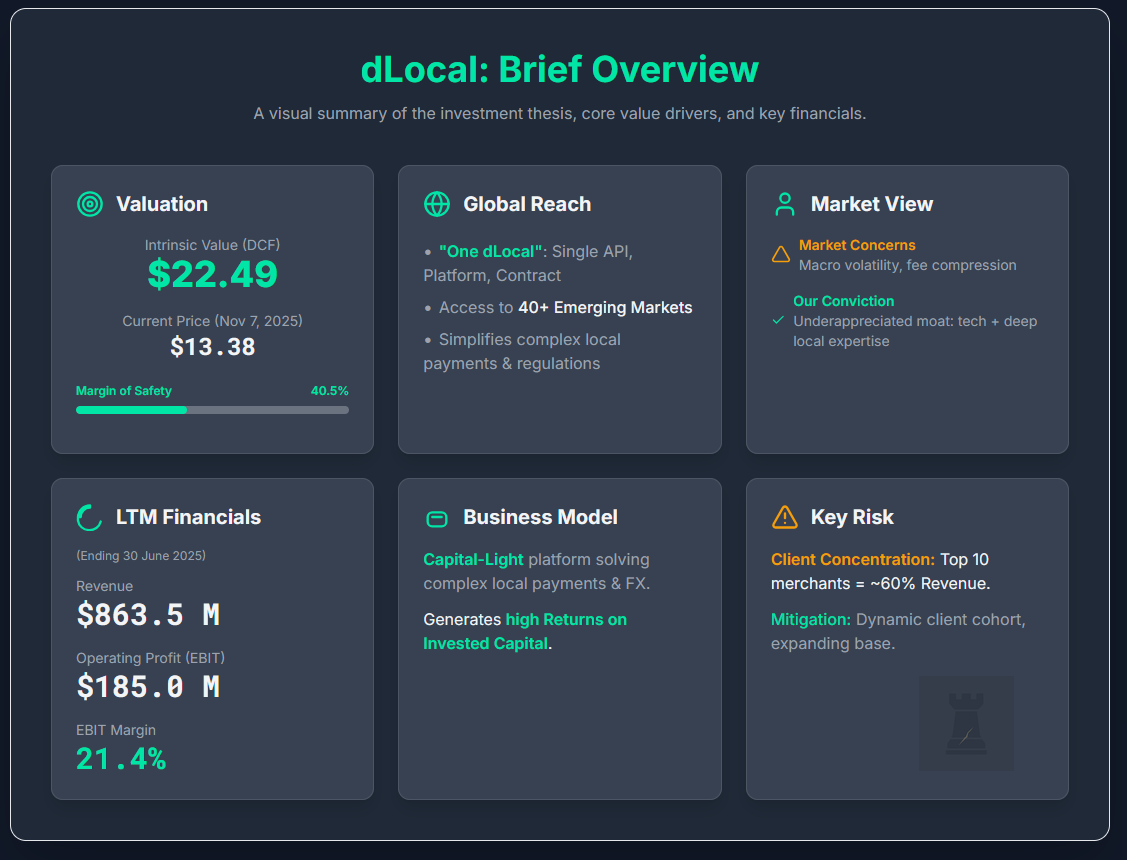
dLocal Limited (DLO) operates as a critical, technology-first payments platform, providing the financial infrastructure that connects global enterprise merchants with billions of consumers in fragmented and complex emerging markets. The fundamental driver of its economic value is a capital-light business model that enables the company to generate exceptionally high returns on invested capital by solving intractable local payment, regulatory, and foreign exchange challenges for its clients. In our eyes, the current market valuation appears to be anchored to concerns over macroeconomic volatility in its key geographies and the spectre of long-term fee compression from competition. This focus, however, seems to underappreciate the durability of dLocal’s moat, which is built not just on technology but on deep, localised operational expertise that is difficult and costly for competitors to replicate at scale.
Our 10-year discounted cash flow (DCF) analysis suggests a base-case intrinsic value of $22.49 per share. At the current price of $13.38 (Nov 7, 2025, intraday), this implies a margin of safety of ~40,5% (1 − (13.38 / 22.49)). This valuation is the result of a fundamentals-based analysis of the company’s long-term cash-generating potential and does not incorporate speculative or short-term market sentiment.
2. Business & Financial Context
dLocal’s core business is simplifying cross-border payments for global merchants through its proprietary “One dLocal” concept. Simply put, there is a single direct API, one platform, and one contract that provides access to pay-ins and pay-outs across more than 40 countries in Africa, Asia, Latin America, and the Middle East. This integrated solution forms the basis of its competitive advantage, abstracting away the immense complexity of managing disparate payment methods, local regulations, and tax regimes. While the company faces concentration risk, with its top 10 merchants consistently representing approximately 60% of revenue, the changing composition of this cohort suggests a dynamic and expanding client base rather than a static dependency.
As of the last twelve months (LTM) ending 30 June 2025, dLocal generated revenue of $863.5 million and an operating profit (EBIT) of $185.0 million, yielding a robust LTM EBIT margin of 21.4%. The company’s capital-light model translates into formidable profitability metrics, wwith a capital-light model that has historically produced returns well above its cost of capital. This high return profile is central to its ability to compound value. The competitive environment includes large global payment platforms like Adyen and Stripe, as well as numerous local specialists. dLocal’s moat is derived from its on-the-ground execution and the network effects of its integrated platform, which become stronger as more merchants and payment methods are added.
3. Discounted Cash Flow (DCF): Assumptions & Methodology
Our valuation is based on a 10-year, three-stage Free Cash Flow to the Firm (FCFF) model. The base year for the forecast is the full fiscal year 2024, with fiscal year 2025 representing Year 1 of the explicit forecast period. All figures we state are in U.S. Dollars.
1/ Revenue Forecast (Years 1–10)
The revenue forecast is built upon the company’s demonstrated ability to capture the secular shift towards digital payments in emerging markets, tempered by the mathematical reality of growth deceleration from a larger revenue base.
Year 0 (FY2024) Base
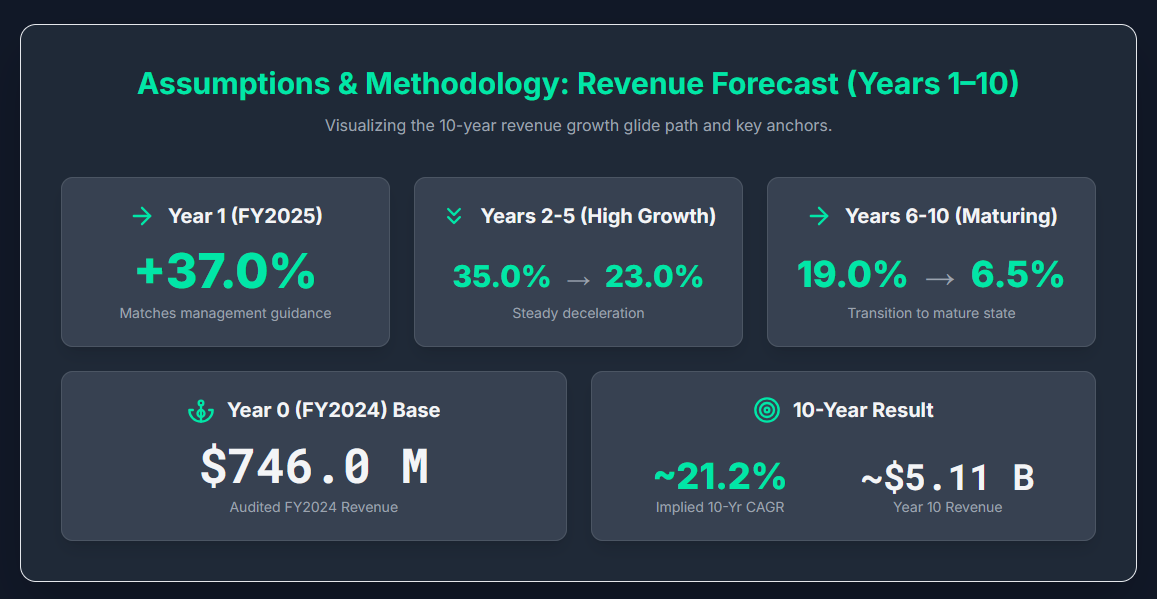
The model is anchored on the audited FY2024 revenue of $746.0 million.
Year 1 (FY2025) Growth
We project 37.0% growth for Year 1, which sits within management’s updated FY2025 guidance range and reflects a prudent deceleration as the company scales.
Years 2–5 (High Growth)
Revenue growth is modelled to decelerate steadily from 35.0% in Year 2 to 23.0% by Year 5 (path: 35.0% → 31.0% → 27.0% → 23.0%). This glide path acknowledges powerful industry tailwinds while incorporating the law of large numbers and rising competition.
Years 6–10 (Maturing Growth)
Growth continues to fade from 19.0% in Year 6 to a pre-terminal rate of 6.5% in Year 10 (path: 19.0% → 16.0% → 13.0% → 9.0% → 6.5%), reflecting the company’s transition toward a more mature state.
This forecast implies a ~21.2% 10-year revenue CAGR, with revenue reaching ~$5.11 billion in Year 10 (growth path used: +37.0%, +35.0%, +31.0%, +27.0%, +23.0%, +19.0%, +16.0%, +13.0%, +9.0%, +6.5%). The model uses reported USD revenue and does not make separate constant-currency adjustments.
2/ Profitability (EBIT → NOPAT)
The profitability forecast balances the potential for operational leverage against inevitable long-term competitive pressure on take rates.
Start EBIT margin
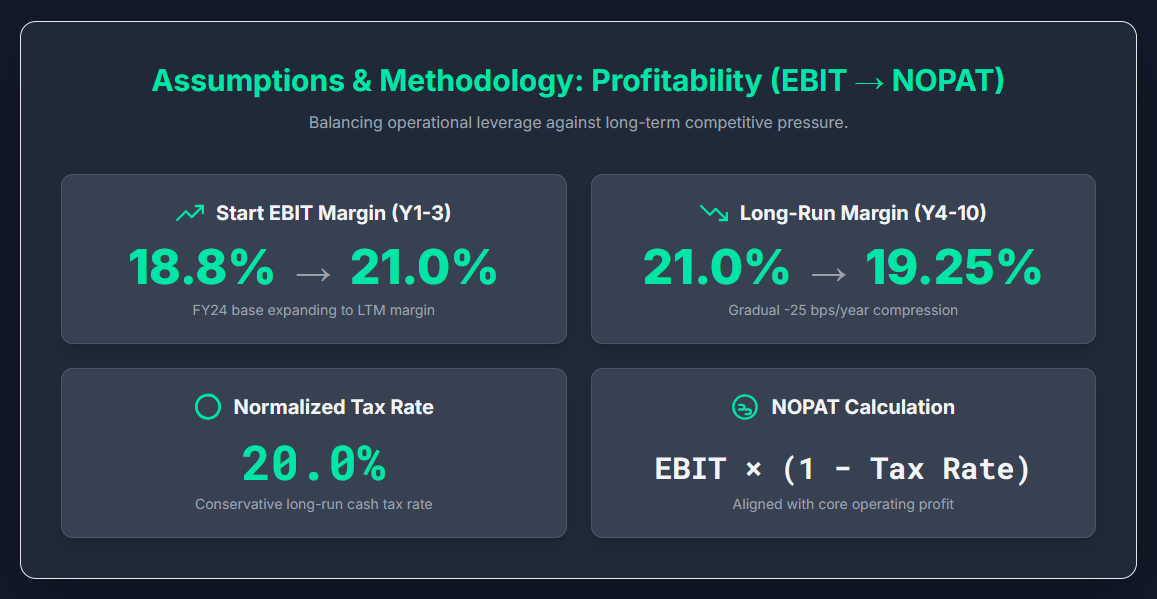
In our model, EBIT refers to IFRS operating profit (“profit from operations”), excluding finance income/costs, inflation adjustment, and other results, thus EBIT margin = operating margin for dLocal. The model begins with the FY2024 EBIT margin of 18.8% ($140.5M EBIT / $746.0M Revenue). We project this margin will expand over the first three years to 21.0%, moving towards the more recent and higher LTM margin of 21.4% , reflecting ongoing operational efficiencies.
Long-run margin path
From Year 4 onwards, we model a gradual compression in the operating (EBIT) margin, declining by ~25 bps per year from the Year-3 level of ~21.0% to a terminal margin of ~19.25% in Year 10 (path: 20.75% → 20.50% → 20.25% → 20.00% → 19.75% → 19.50% → 19.25%). This is intentionally conservative as we assume rising competition exerts fee pressure that is only partly offset by scale benefits and tech efficiencies. A durable moat prevents a margin collapse, but not a modest decline.
Tax rate
We assume a normalised cash tax rate of 20.0% for the forecast period. For context, management reported an effective tax rate of ~10% in Q1 2025 (favourably impacted by a one-off item in Brazil) and ~16% in Q2 2025 as mix normalised and the local-to-local share of pre-tax income rose. Using 20% is therefore a conservative long-run assumption that allows for geographic mix shifts and fewer one-offs.
NOPAT Calculation
Net Operating Profit After Tax (NOPAT) = Operating EBIT × (1 − operating tax rate), where Operating EBIT is IFRS operating profit (“profit from operations”) (i.e., excludes finance income/costs, inflation adjustment, and other results). This keeps NOPAT aligned with core operating performance.
3/ Reinvestment & ROIC
Capex
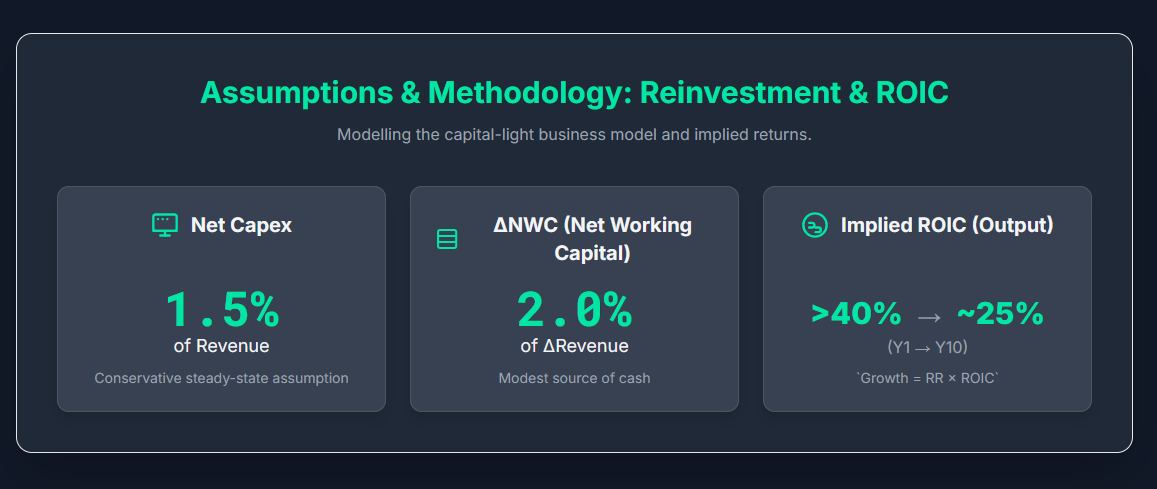
In FY2024, capital expenditures (defined by dLocal as acquisitions of property, plant & equipment plus additions of intangible assets) totaled ~$22.6m (PPE ~$1.7m, intangibles ~$20.9m), which is ~3.0% of the $746.0m FY2024 revenue. FY2024 D&A totaled ~$17.4m (amortisation of intangibles ~$15.5m, depreciation and ROU depreciation/disposals ~$1.9m), implying net capex of ~0.7% of revenue. We model net capex at 1.5% of revenue through the forecast as a conservative steady-state assumption (above the FY2024 run-rate). This reflects a mature investment profile focused on maintaining and enhancing its technology platform.
Net working capital (NWC)
The company operates with merchant float dynamics (it explicitly reports ‘own funds’ vs ‘merchants’ funds’) and period-to-period settlement timing can swing working capital materially. FY2024 saw large working-capital movements tied to receivables and payables, highlighting this volatility. To avoid overstating float benefits, we model Change in NWC as a modest source of cash equal to 2.0% of the YoY revenue increase.
ROIC
Given the combination of healthy NOPAT margins and low reinvestment (net capex and modest NWC needs), our model yields an implied incremental ROIC that starts >40% and fades to ~25% by Year 10. We treat these as model outputs (not company-reported metrics). A ~25% terminal ROIC sits well above a reasonable cost of capital for an EM payments processor, consistent with durable economic profits. The identity Growth = Reinvestment Rate × ROIC is applied throughout.
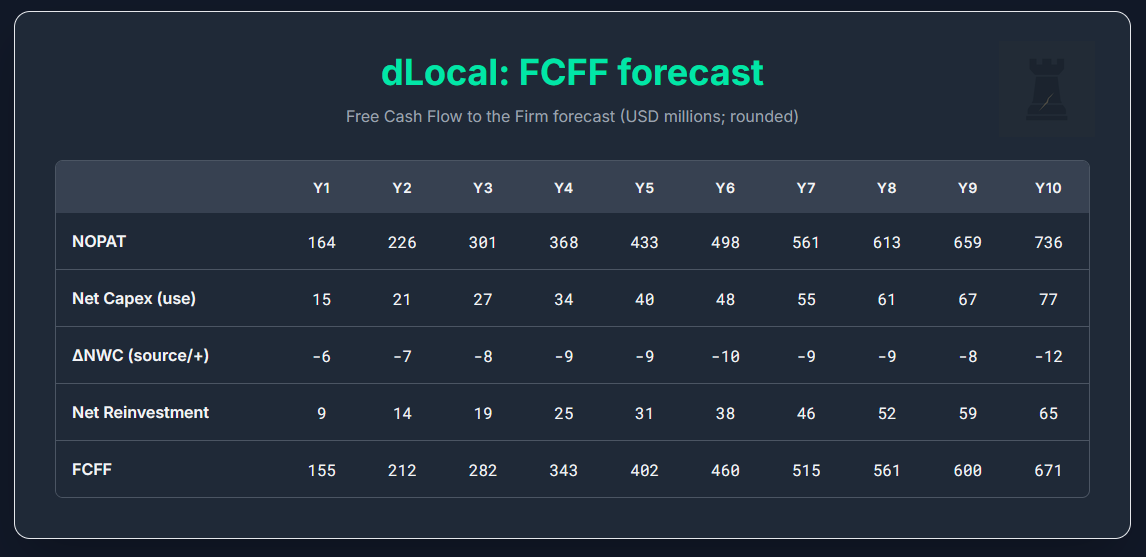
4/ Free Cash Flow to the Firm (FCFF)
FCFF is calculated as NOPAT minus Net Reinvestment, where Net Reinvestment is the sum of Net Capex (use of cash) and Change in NWC (use = positive, source = negative.
5/ Discount Rate (WACC)
We discount USD cash flows using a CAPM-based cost of equity and a synthetic, after-tax cost of debt. Target weights reflect an equity-funded profile.
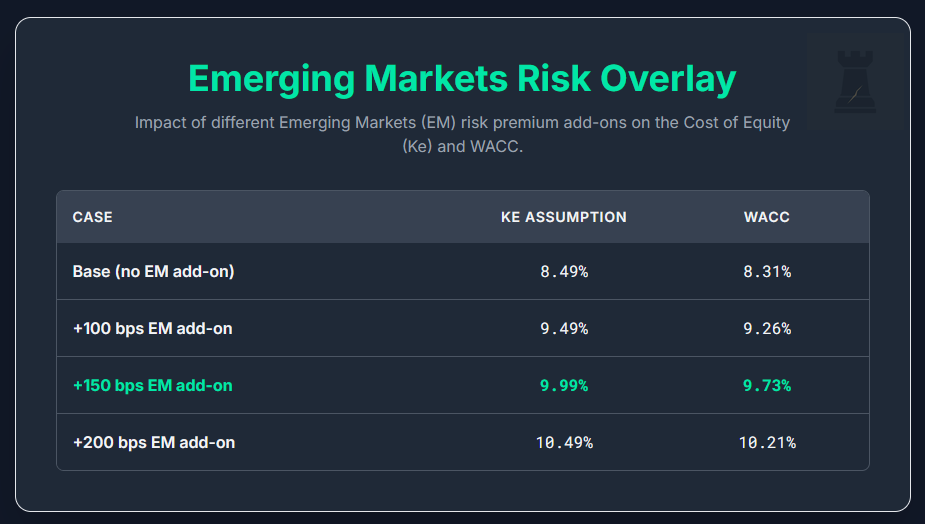
EM risk overlay
Because revenue is concentrated in emerging markets, we show a simple add-on to Ke for country-risk exposure:
Inputs
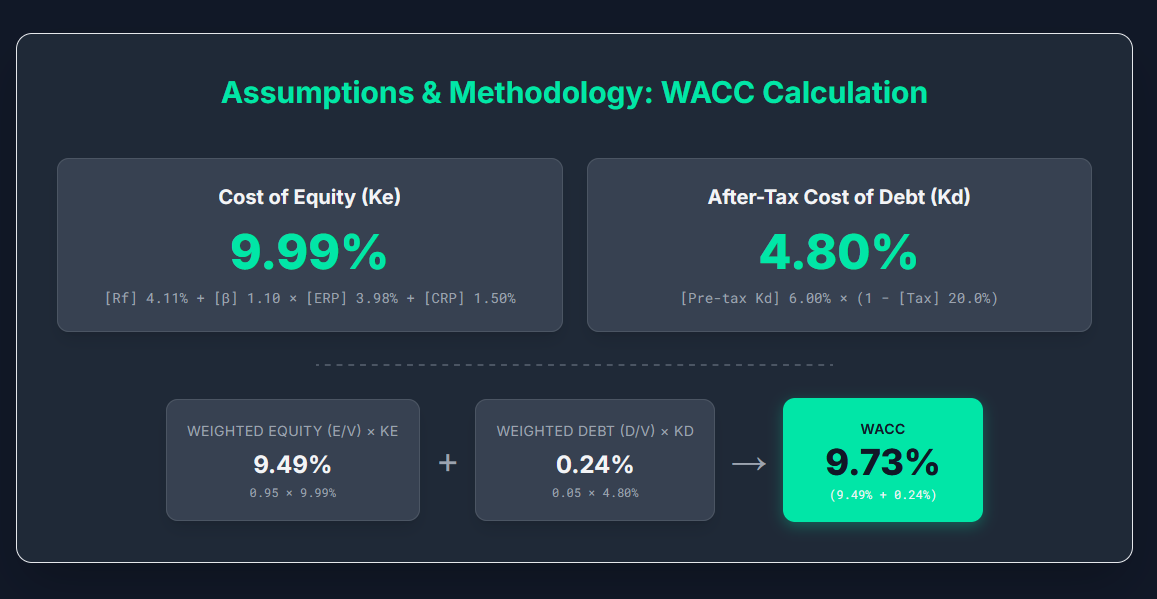
Risk-free rate (Rf): 4.11%
Levered beta (β): 1.10
Equity risk premium (ERP): 3.98% (US implied)
Country Risk Premium (CRP): 1.50%
Cost of equity (Ke): Rf + β × ERP + CRP= 4.11% + 1.10 × 3.98% + 1.50 = 9.99%
Pre-tax cost of debt: 6.00%
Normalised tax rate: 20.0% → After-tax Kd = 6.00% × (1 − 0.20) = 4.80%
Target capital weights: E/V = 95%, D/V = 5%
WACC calculation
WACC = (E/V) x Ke + (D/V) x Kd = 0.95 x 9.99% + 0.05 × 4.80% = 9.7305% (rounded to 9.73%)
6/ Terminal Value
We assume a stable-growth phase after Year 10. Year-10 FCFF of $671m is rolled forward by our perpetual growth rate of 2.5% to ~$688m for Year 11. Capitalising that steady-state cash flow at our base discount rate (WACC 9.73%) gives a terminal value at Year 10 of ~$9.5bn. Discounting that back to today at the same rate yields a present value of ~$3.76bn.
For context, the present value of Years 1–10 FCFF is ~$2.35bn, so the implied enterprise value is ~$6.10bn, with the terminal value contributing ~62% of the total—well within the typical range for a durable, growing, cash-generative business. (Sensitivity: if we used the lighter 8.31% WACC with no EM risk add-on, the PV of the terminal value would be ~$5.33bn and the terminal share ~68%.)
4. Results & Market-Implied Expectations
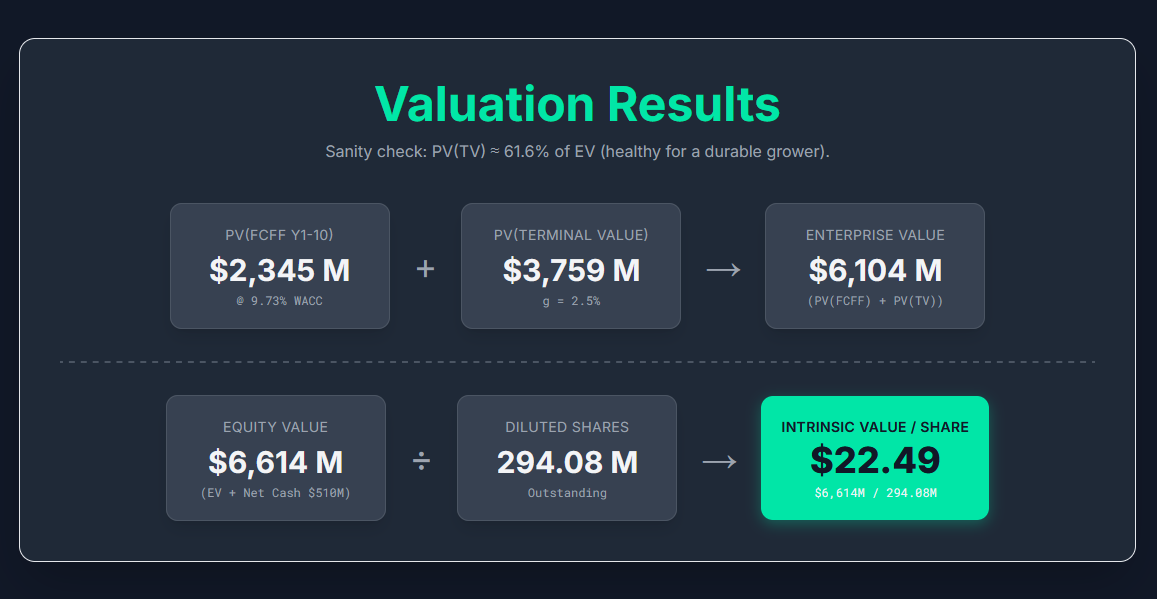
Summing the present value of the 10-year FCFFs and the present value of the terminal value yields us the intrinsic enterprise value. Adjusting for net cash and dividing by the share count gives the intrinsic value per share:
PV of Stage-1 FCFF (Y1–Y10 @ 9.73%): ~$2,345m
PV of Terminal Value (g = 2.5% @ 9.73%): ~$3,759m
Enterprise Value (EV): ~$6,104m
(+) Net Cash (30 Jun 2025): ~$510m
Equity Value: ~$6,614m
Diluted Shares Outstanding: ~294.08m
Intrinsic Value per Share: ~$22.49
Sanity check: PV(TV) ≈ 61.6% of EV (healthy for a durable grower).
Intrinsic Value per Share (Base Case): $6,614m / 294.08m = $22.49
For context (same inputs, different WACC):
WACC 8.31% → IV/share ~$28.47; PV(TV) = 67.8% of EV.
WACC 10.15% → IV/share ~$21.16; PV(TV) = 59.9% of EV.
Scenarios
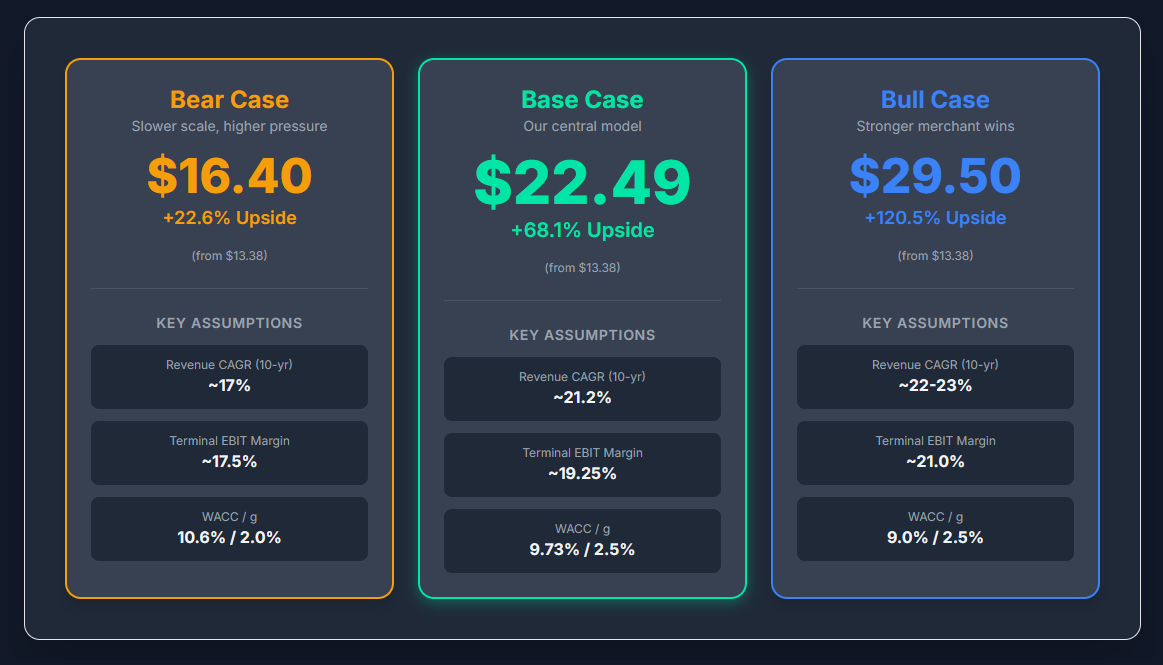
Base Case ($22.5)
Our central model, described with methodology above.
Bear Case ($16.4)
Assumes slower scale, heavier take-rate pressure, and higher risk.
Revenue path: softer curve, Year-5 growth ~15%, 10-yr CAGR ~17%
Operating margin path: peaks lower; terminal ~17.5%
Reinvestment: net capex 1.7% of revenue, ΔNWC = 1.0% of YoY revenue increase (smaller float benefit)
Tax: 22%
Discount & terminal: WACC 10.6%, g 2.0%
Result: EV and equity down ~27% vs Base
Final Intrinsic Value: $16.4 per share
Bull Case ($29.5)
Assumes stronger merchant wins, slightly better mix/take-rates, and lower perceived risk.
Revenue path: fatter mid-curve; Year-5 growth ~25%; 10-yr CAGR ~22–23%
Operating margin path: reaches ~21.5% by Yr-3 and holds ~21.0% in Yr-10
Reinvestment: net capex 1.3% of revenue; ΔNWC = 2.5% of YoY revenue increase (larger float benefit)
Tax: 19%
Discount & terminal: WACC 9.0%, g 2.5%
Result: Equity up ~31% vs Base
Final Intrinsic Value: ~$29.5 per share
Reverse DCF: Market-Implied Expectations
At $13.38 per share (equity value = $3.93bn., EV = $3.42bn after net cash), holding all base-case assumptions constant (same 10-year FCFF path, same WACC 9.73%), the price implies a perpetual growth rate g = –11.9%.
In other words (and plain English :), after a decade of growth, the market is pricing dLocal as if its free cash flow then declines forever. Even if you push risk higher to WACC 10.6%, the implied g = –8.3%. That’s far more pessimistic than a steady-state “treading water” assumption.
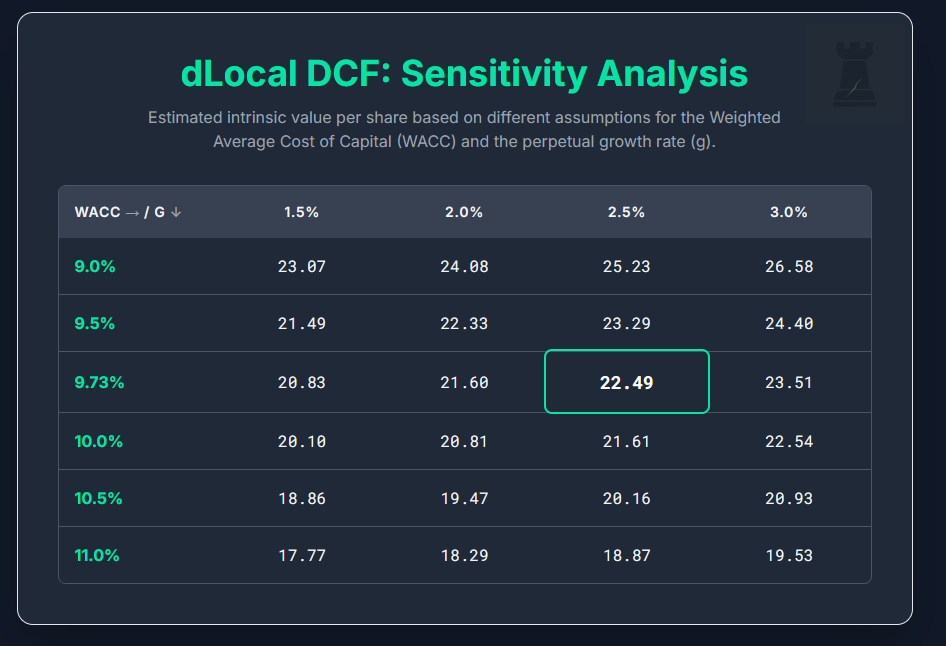
Sensitivity Analysis
Intrinsic value per share across WACC (rows) and terminal g (columns).
5. Conclusion: Margin of Safety & Final Verdict
Our base-case intrinsic value of dLocal is $22.49 per share (WACC 9.73%, g 2.5%).
The current price at the time of analysis is $13.38.
Margin of Safety (MoS) = 1−13.38/22.49 = ~40.5%. That’s the very top of our 15–40% “Undervalued” band. Even under a more conservative risk setup (WACC ~10.6%; IV = $21.15), the MoS is ~36.7%.
The business model of dLocal is capital-light, cash-rich, and designed to scale. Our DCF does not need heroics. We layer a realistic growth fade, modest margin compression, explicit EM risk in the discount rate, and a conservative terminal assumption. The resulting value is not a moonshot. It is what you get when a high-return operator continues to execute in markets that are still early in digital payments adoption.
Could things go wrong? Yes. We will watch for sustained take-rate compression that exceeds our glide, a regulatory shock in key countries, worsening top-merchant concentration, or ROIC erosion. Could things go (more than) right? Also yes. New merchant wins, product mix improving payout economics, cleaner disclosures on “own funds” vs “merchants’ funds,” and steady operating leverage can all close the gap faster than the market expects.
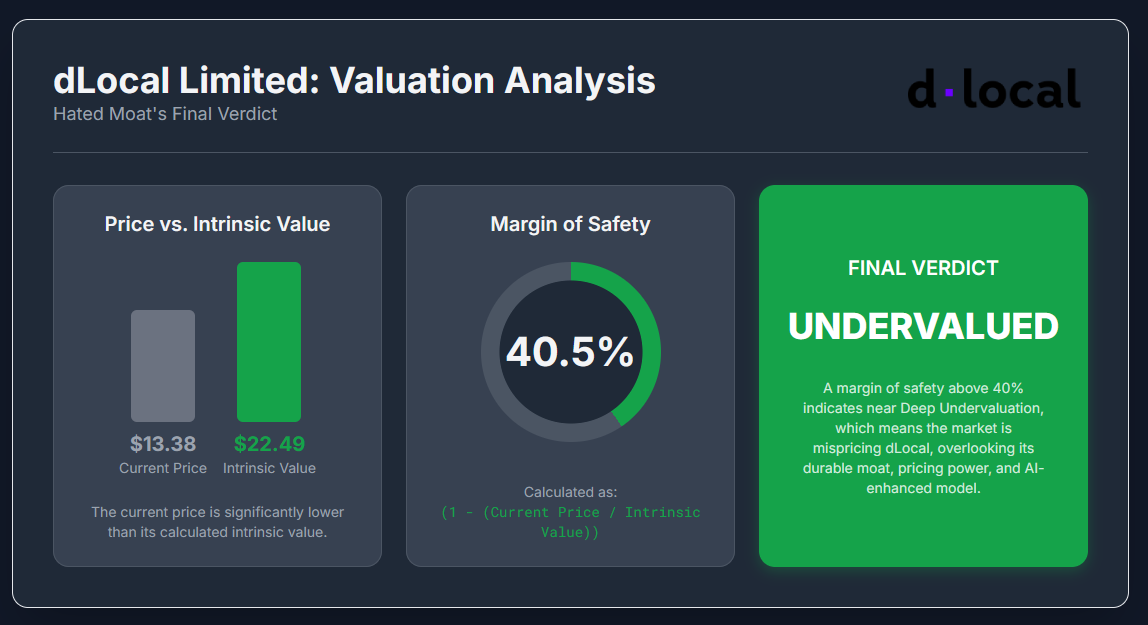
Final verdict: Undervalued.
The market is over-penalising quantifiable EM risk and under-crediting a moat that is built on local execution and integration depth. Our work shows a wide, defensible margin of safety at today’s price without stretching assumptions.
Disclosure
The author of this report does hold positions in the securities of DLocal Limited (DLO). This report is for informational purposes only and does not constitute investment advice or a recommendation to buy or sell any security.
Nice write up, thank you.
Any expectations for upcoming earnings?