
MercadoLibre: Valuation Model
MercadoLibre has conquered Latin American commerce. But is the stock still cheap enough to buy? - DCFriday #019

Date of Analysis: June 30 - July 9, 2026
Verdict: Fairly Valued to Slightly Undervalued
Current Price Target (Base Case): $1,980
Price at the Time of Analysing: $1,807.83
MercadoLibre is a high-quality commerce and fintech ecosystem, but its 3 main engines (Commerce, Payments and Credit) require different valuation methods. Our presented sum-of-the-parts model values Commerce and Payments through FCFF, while Mercado Crédito is valued separately because lending requires funding and equity capital.
Our base case suggests the stock is mildly undervalued, but the key question is whether MercadoLibre can keep scaling Commerce and Payments margins while Credit continues earning returns above its cost of equity.

1. Valuation Methodology: Three Engines, One Equity Value
MELI 0.00%↑ combines commerce, logistics, payments and lending. Each part of the business has different cash-flow, funding and capital needs. In Q1 2026, Commerce and Fintech revenue grew by 47.4% and 51.1%, respectively, while the operating margin fell to 6.9% as the company continued investing for growth. These figures reconcile with reported Q1 2026 Commerce revenue of $4.87 billion, Fintech revenue of $3.98 billion, income from operations of $611 million and total net revenue and financial income of $8.85 billion.
A simple operating cash flow minus capex calculation can be misleading for this business. Q1 operating cash flow of $2.075 billion and investment in property, equipment and intangible assets of $271 million implied $1.804 billion of unadjusted cash flow. However, management’s non-GAAP adjusted FCF was negative $56 million after accounting for restricted and customer-related funds, loan growth and fintech funding.
Because the business is complex, a single consolidated DCF is too blunt. Our model therefore separates MercadoLibre into 3 analyst-defined businesses:
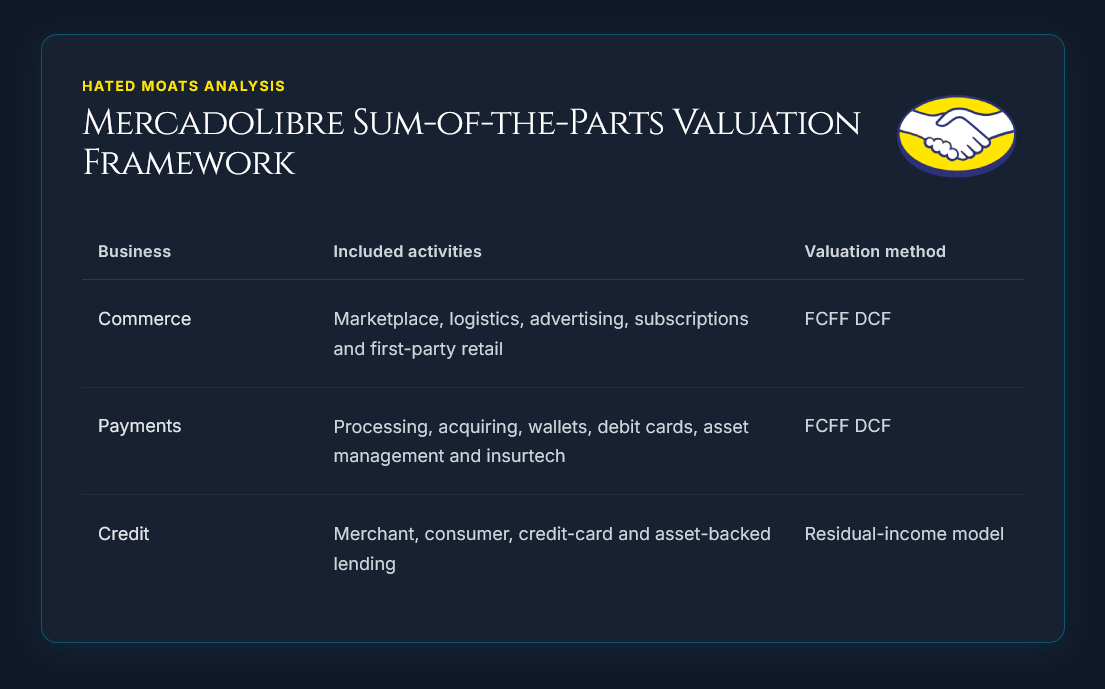
These are not MercadoLibre’s reported segments, which are geographical. Commerce and Fintech are reported revenue streams, so business-level margins, capex, working capital and invested capital require our own allocation.
Commerce and Payments are valued through Free Cash Flow to the Firm (FCFF). Credit is valued as allocated equity plus the present value of returns above its cost of equity. Customer funds, restricted assets and fintech funding remain inside the relevant operating models and aren’t later treated as excess cash or corporate debt.
Shared technology, marketing, administration, depreciation and capex are allocated once across Commerce, Payments and Credit. Lending provisions and related funding costs are assigned only to Credit. Any remaining corporate cost is deducted once through the reconciliation.
For marketplace transactions, payment-processing economics are embedded in broader marketplace monetisation rather than disclosed as a separate standalone Payments segment. Our model therefore assigns the related processing costs and a normal operating return to Payments, with an equal internal charge to Commerce. This changes the allocation between the 2 businesses but doesn’t affect consolidated value.
The final bridge is:
MELI Equity Value = Commerce Enterprise Value + Payments Enterprise Value + Credit Equity Value + Excess Non-operating Cash and Investments - Commerce and Corporate Debt - Other Non-operating Claims
Fintech funding already included in Payments or Credit isn’t deducted again. Lease liabilities are also not deducted separately while lease expenses remain within segment margins.
Reported figures anchor the consolidated totals. Business margins, capital requirements and excess cash remain our assumptions and must reconcile with MercadoLibre’s financial statements.
2. Commerce DCF
Commerce includes marketplace, logistics, advertising, subscriptions, classifieds and first-party retail. It generated $16.29B of revenue in 2025, made up of $12.75B from services and $3.54B from product sales.
First-party retail increases reported revenue, but it has lower margins and requires inventory. Logistics benefits from delivery density, but free shipping and network investment still weigh on profitability. MercadoLibre reported that its fulfilment network absorbed a 41% increase in sold items during 2025, while unit shipping costs fell in Brazil, Mexico, Chile and Colombia in Q4 2025. This shows both the benefits of scale and the need for continued investment.
Base-Case Forecast
Our model forecasts 2026 revenue of $21.6B, up 32.6%. This is below Q1 growth of 47.4% in US dollars and 39% on an FX-neutral basis. Q1 benefited from 42% GMV growth, stronger Brazilian and Mexican currencies and a $510 million increase in Commerce product sales.
Growth falls from 25% in 2027 to 6% by 2035 in this model. This forecast thus produces a 15.5% compound annual growth rate from 2025A to 2035E and a 13.7% compound annual growth rate from 2026E to 2035E.
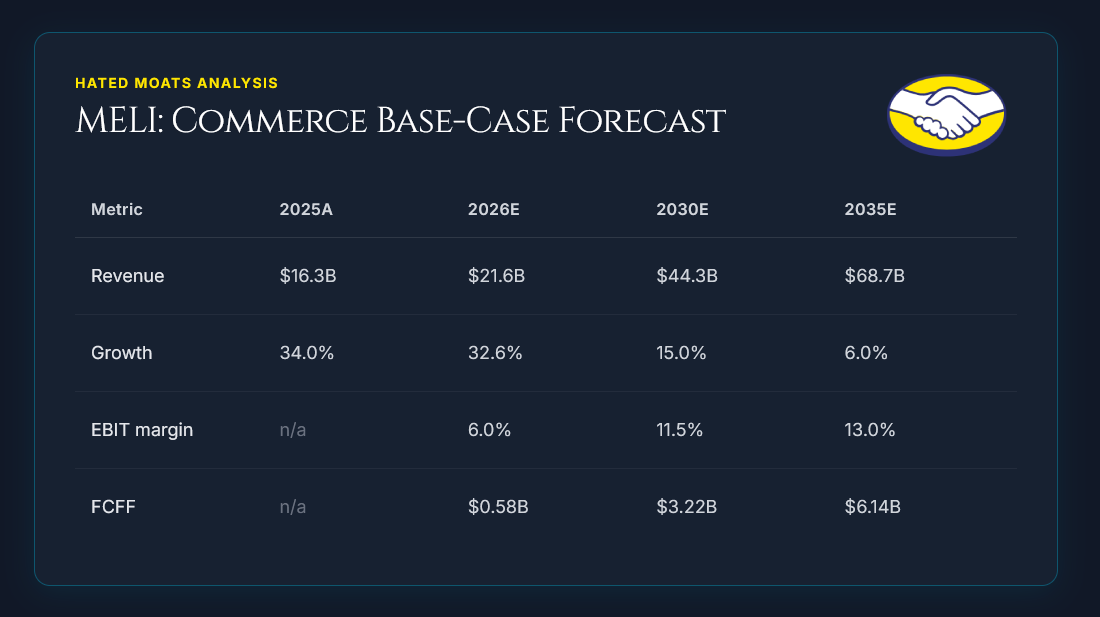
The fully loaded EBIT margin includes allocated technology, marketing, customer-service and administrative costs, together with Commerce’s internal charge for on-platform payment processing.
The increase to 13% assumes more advertising revenue, better logistics efficiency and operating leverage. MercadoLibre’s consolidated gross margin fell from 46.7% to 43.7% in Q1 2026, mainly because of lower free-shipping thresholds, higher shipping costs and faster growth in lower-margin product sales.
MercadoLibre doesn’t disclose Commerce-only EBIT, so the forecast margins are our estimates.
Reinvestment
Free Cash Flow to the Firm is calculated as:
FCFF = EBIT x (1 - tax rate) + depreciation and amortisation - capex - change in net working capital
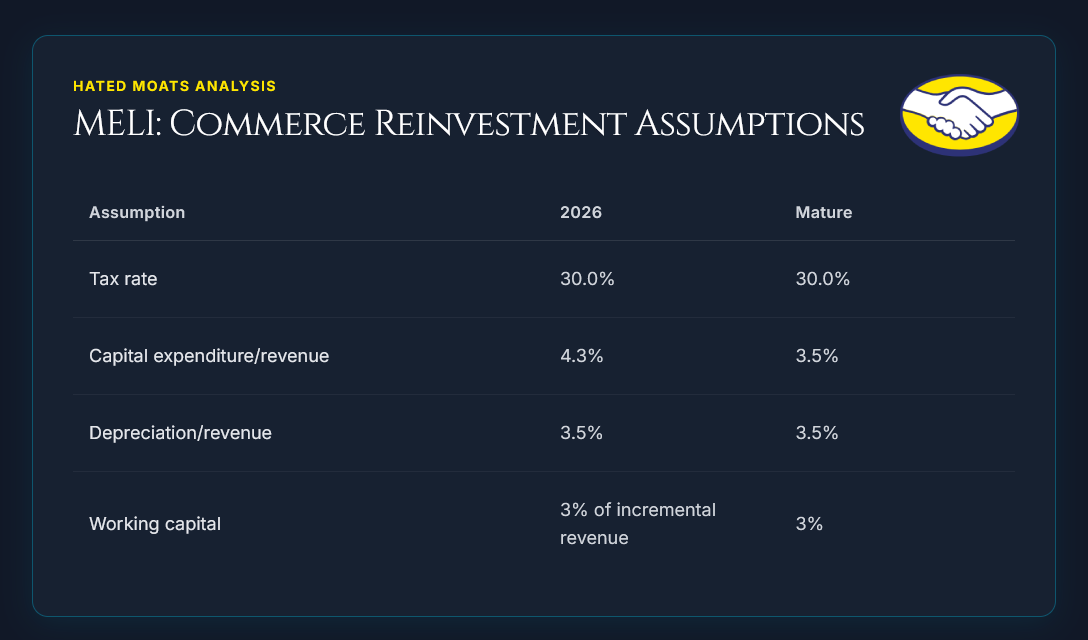
These are our assumptions and they must reconcile with consolidated capex, depreciation and working capital.
The terminal case uses a 20% economic return on invested capital. At 3.5% terminal growth, this implies reinvestment equal to 17.5% of NOPAT.
Terminal reinvestment rate = 3.5% growth / 20% ROIC = 17.5%
A material portion of MercadoLibre’s reinvestment is already expensed through technology, marketing, incentives and customer acquisition. Adding the full economic reinvestment requirement again to accounting capex would therefore double count part of the investment.
Valuation
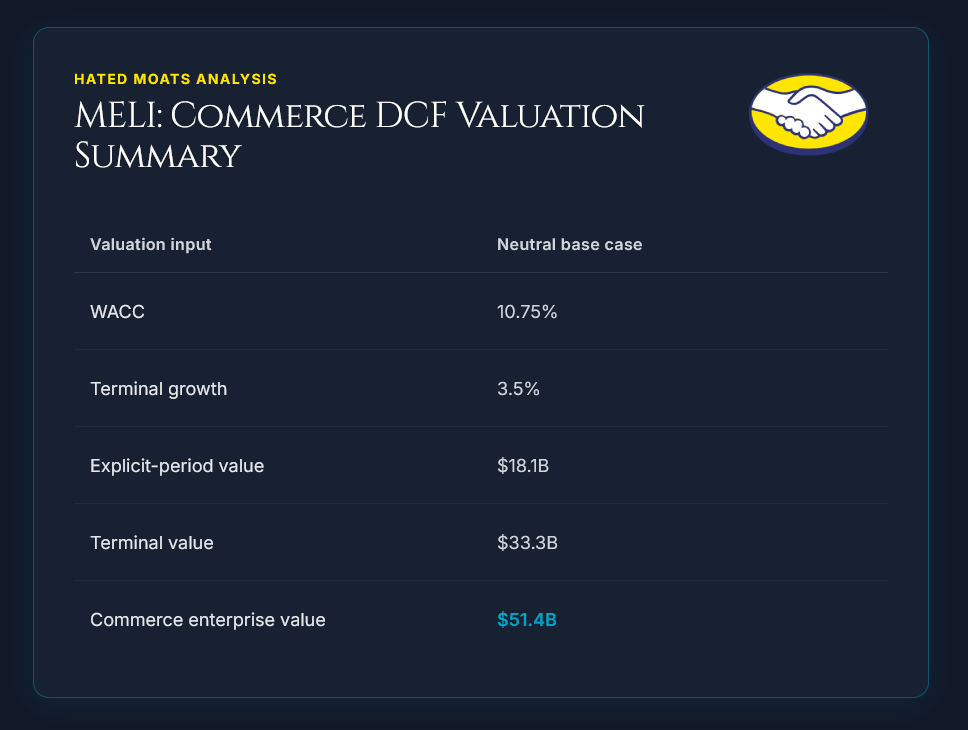
Our valuation uses a stub period and consistent discounting from 6 July 2026. Approximately 65% of the value comes from the terminal period.
The result equals roughly 2.4x estimated 2026 Commerce revenue and 10.1x estimated 2030 Commerce EBIT.
The main risk here is that first-party retail, free shipping and logistics investment prevent the fully loaded EBIT margin from reaching 13%.
3. Mercado Pago, Excluding Credit
This model covers acquiring, wallets, debit cards, asset management, insurtech and point-of-sale devices.
Reported Financial Services and Income plus fintech product sales totalled $6.74B in 2025, while Credit revenues totalled $5.86B. Total reported Fintech revenue was $12.60B in 2025. Financial Services and Income includes some financing transactions, so the allocation between Payments and Credit must remain consistent.
Q1 total payment volume rose 50% to $87.2B, acquiring TPV reached approximately $56.0B and transactions reached 4.64B. Monthly active users increased to 83 million, although this measure includes some users of credit products.
On-platform payment processing is economically included within marketplace monetisation. The model assigns the processing costs and a normal operating return to Payments, with an equal internal charge to Commerce. Conversion, retention and data benefits remain reflected in Commerce growth and margins rather than receiving a separate ecosystem premium.
Base-Case Forecast
Revenue grows from $8.5B in 2026 to $27.1B in 2035. This forecast produces a 14.9% compound annual growth rate from 2025A to 2035E and a 13.7% compound annual growth rate from 2026E to 2035E. The forecast assumes continued TPV and wallet growth without relying on higher payment take rates.
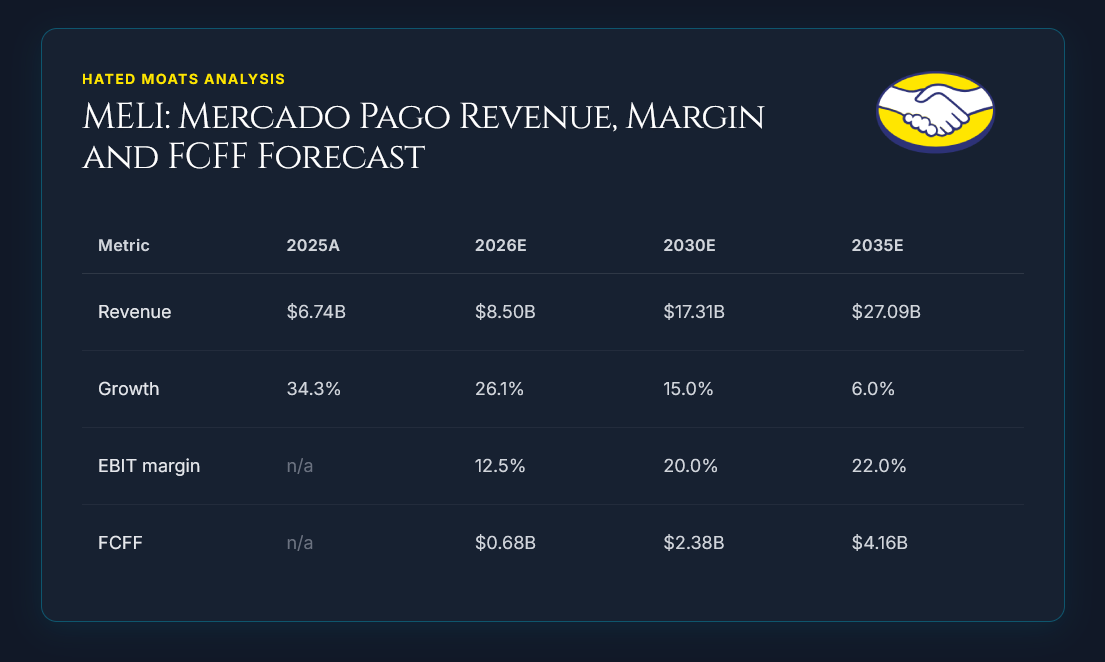
The fully loaded EBIT margin includes allocated technology, compliance, marketing and administrative costs, together with the internal return assigned to on-platform payment processing.
Interest earned on assets supporting customer balances remains in operating earnings. The matching restricted assets and customer liabilities aren’t treated as excess cash.
MercadoLibre doesn’t disclose Payments-only EBIT, so the forecast margins are yet again our estimates.
Reinvestment
Free Cash Flow to the Firm is calculated as:
FCFF = EBIT x (1 - tax rate) + depreciation and amortisation - capex - change in net working capital
The model uses the same 30.0% tax rate used in the Commerce DCF.
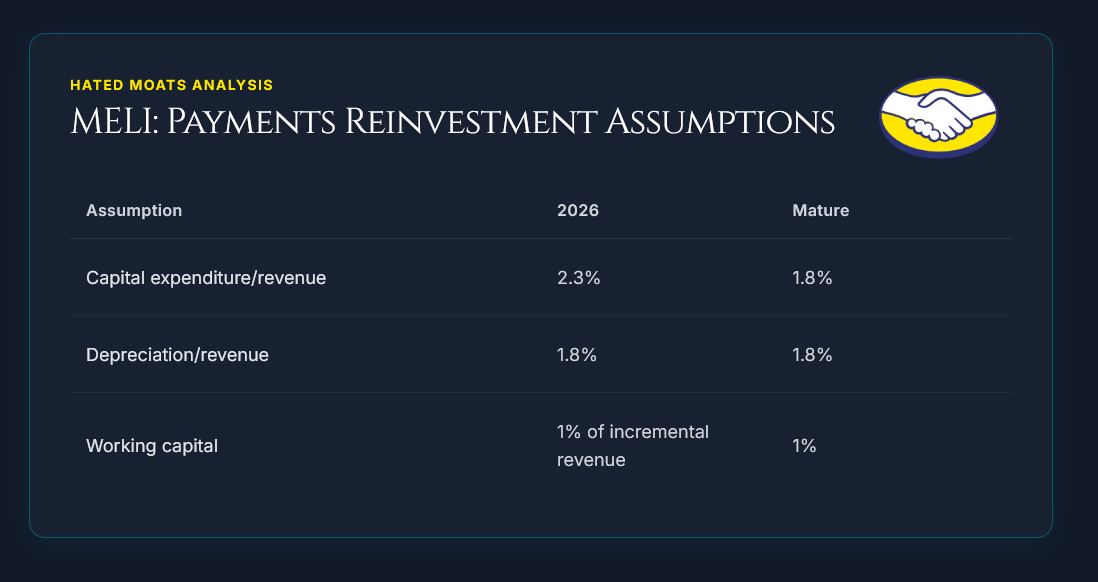
These are our assumptions and they must reconcile with consolidated capex, depreciation and working capital. The terminal case uses a 25% economic return on invested capital. At 3.5% terminal growth, this implies reinvestment equal to 14% of NOPAT.
Terminal reinvestment rate = 3.5% growth / 25% ROIC = 14.0%
As with Commerce, part of this reinvestment is already expensed within technology, compliance, customer incentives and product development.
Valuation
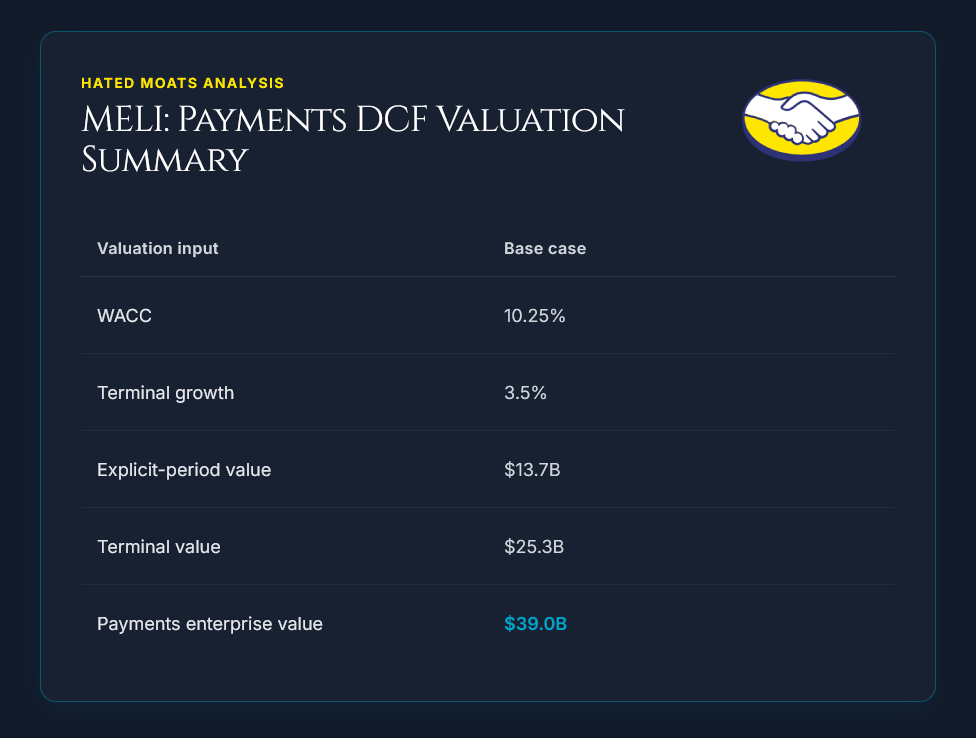
Our valuation uses a stub period and consistent discounting from 6 July 2026. Approximately 65% of the value comes from the terminal period.
The result equals roughly:
4.6x estimated 2026 Payments revenue and 11.3x estimated 2030 Payments EBIT.
The main risk here is that competition, regulation, compliance costs or lower payment take rates prevent the fully loaded EBIT margin from reaching 22%.
4. Mercado Crédito: Valuing the Lending Business
We value Mercado Crédito separately because lending requires funding and equity capital, making conventional FCF less useful.
At 31 March 2026, gross loans were $14.56B and net loans were $10.74B:
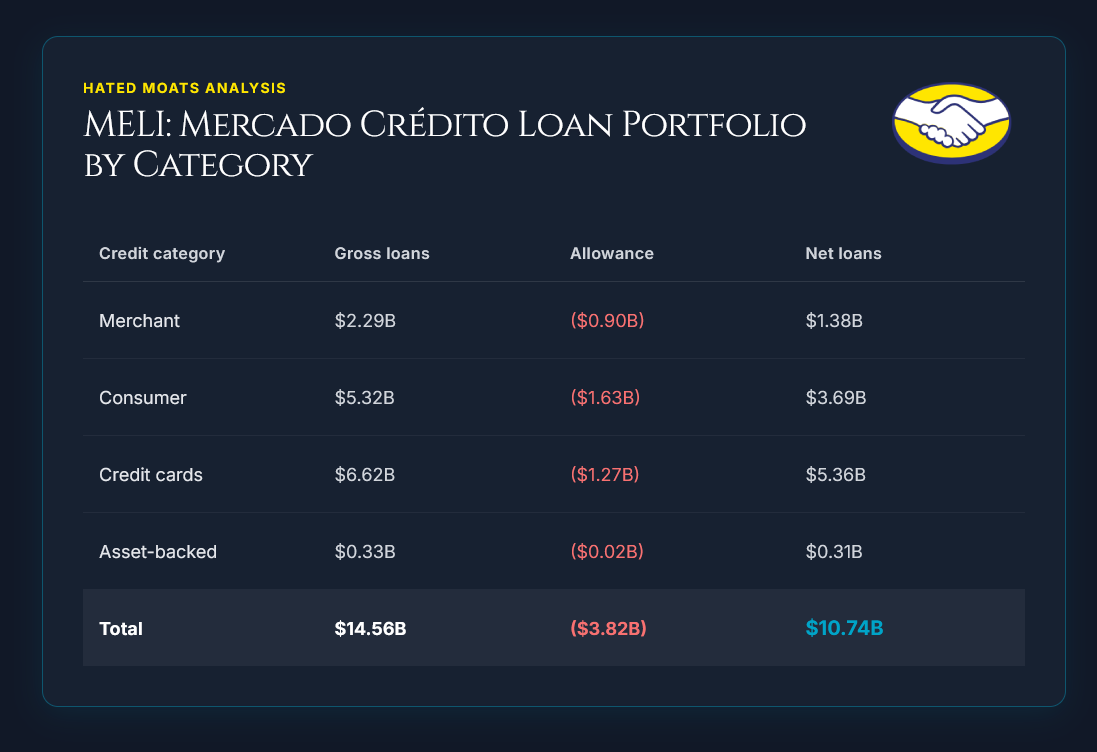
Unused credit-card commitments added $11.89B of potential exposure, although only part is likely to be drawn. The allowance equalled approximately 26% of gross loans, reflecting expected-loss accounting, unsecured lending risk and product mix.
Q1 provisions rose to $1.24B as the loan portfolio expanded quickly, especially in consumer loans and credit cards. NIMAL fell from 22.7% to 17.8%. The sequential decline mainly reflected seasonality, while the YoY decline was driven by a higher credit-card mix and greater provisions in Brazil. The 15-to-90-day delinquency ratio remained broadly stable at 8.0%.
Required Equity and Forecast
The model allocates equity equal to 24% of net loans, falling to 20% as the portfolio matures.
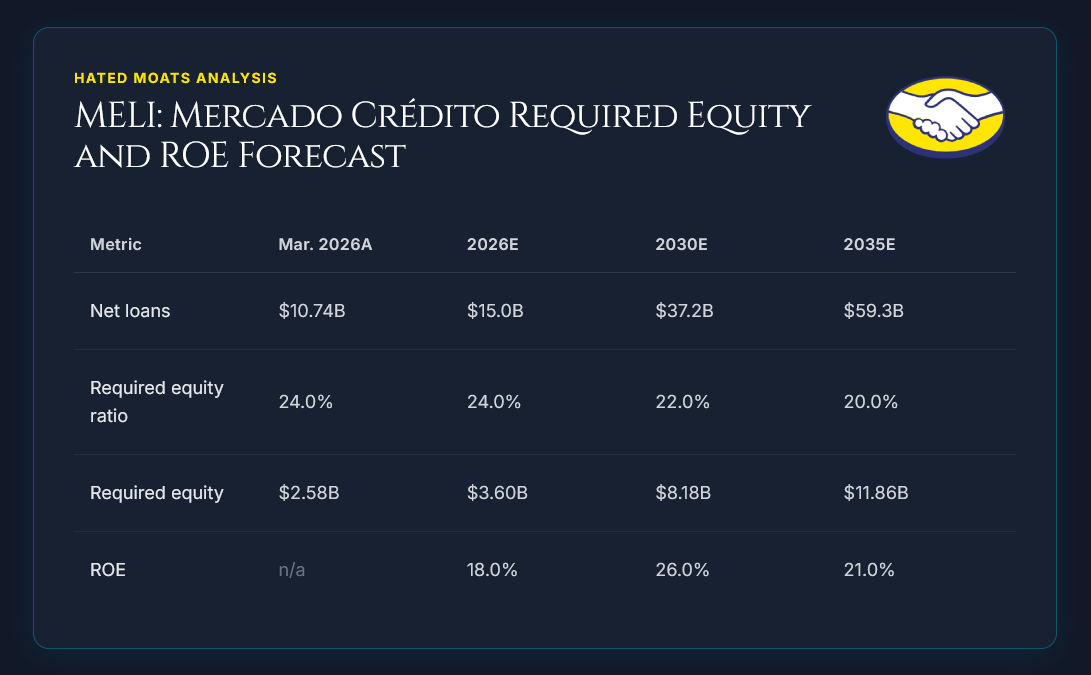
The initial 24% equity ratio equals approximately 17.7% of gross loans. It is conservative relative to many conventional bank equity cushions, but it it’s not directly comparable because Mercado Crédito has substantial unsecured exposure, a high allowance ratio and significant undrawn commitments.
Funding diversification can lower financing costs and liquidity risk, but it reduces required equity only where credit risk is truly transferred. The decline to 20% therefore assumes improving portfolio performance and greater risk transfer rather than funding diversification alone.
The 60% forecast growth for 2026 is measured from December 2025 net loans of $9.37B rather than from March 2026.
ROE rises as newer cohorts mature and operating costs scale, then declines as competition, regulation and credit losses increase. The forecast should reconcile with NIMAL, average gross loans, operating expenses and tax rather than being treated as an independent input.
Residual-Income Valuation
Credit Equity Value = Current Allocated Equity + Present Value of Future Residual Income, where:
Residual Income = (ROE - Cost of Equity) x Opening Equity
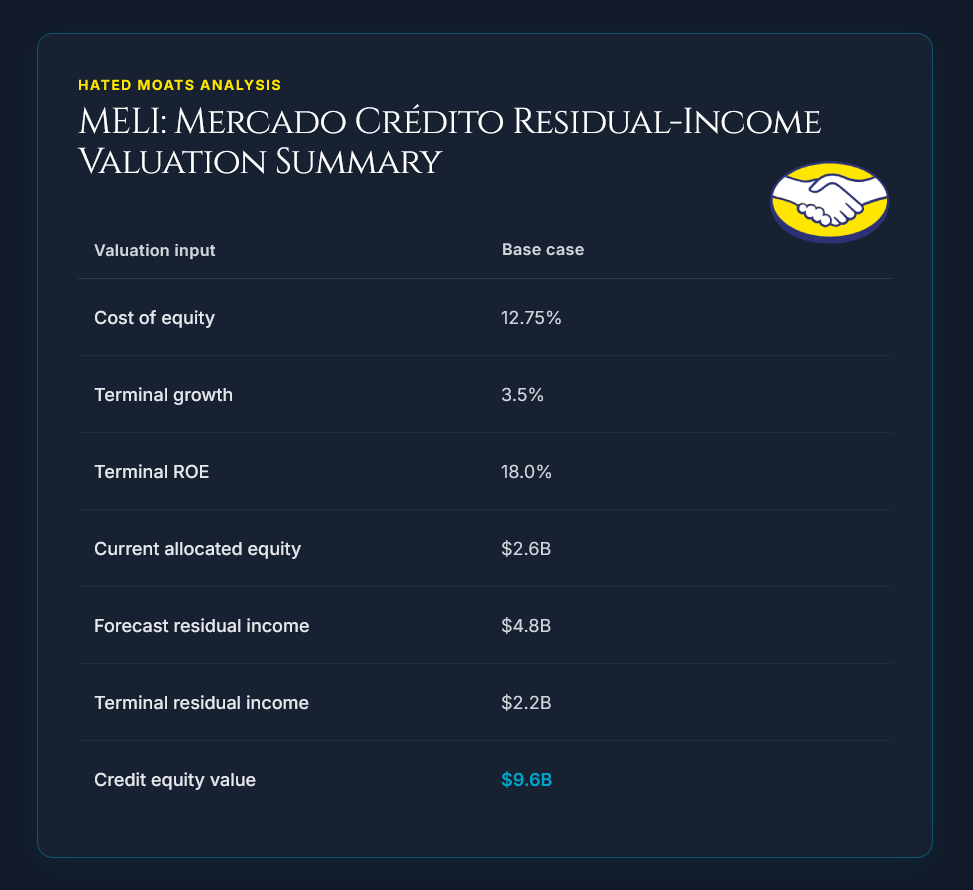
An 18% terminal ROE and 3.5% growth imply a retention rate of approximately 19%.
Retention rate = 3.5% growth / 18% ROE = 19.4%
The valuation remains highly sensitive to credit losses, funding costs and required capital. Required equity should therefore be generally tested at 20%, 24% and 28% of net loans.
5. Discount Rates & Terminal Assumptions
The core of valuation is denominated in USD and dated 6 July 2026. The 10-year US Treasury yield was 4.48% on this date.
The model uses a 4.20% mature-market equity risk premium, close to Damodaran’s January 2026 estimate of 4.23% and July 2026 estimate of 4.17%.
Bottom-up betas are based on global marketplace, payment-processing and consumer-finance comparables.
Country-risk premiums are then added separately because bottom-up peer betas don’t fully capture MercadoLibre’s Latin American exposure. Damodaran’s January 2026 country-risk data placed the additional country-risk premiums for Brazil, Mexico and Argentina materially above mature-market levels, at approximately 3.24%, 2.46% and 9.71%, respectively.
Discount rates are estimated as:
Cost of equity = Risk-free rate + Beta x Mature-market ERP + Country-risk overlay
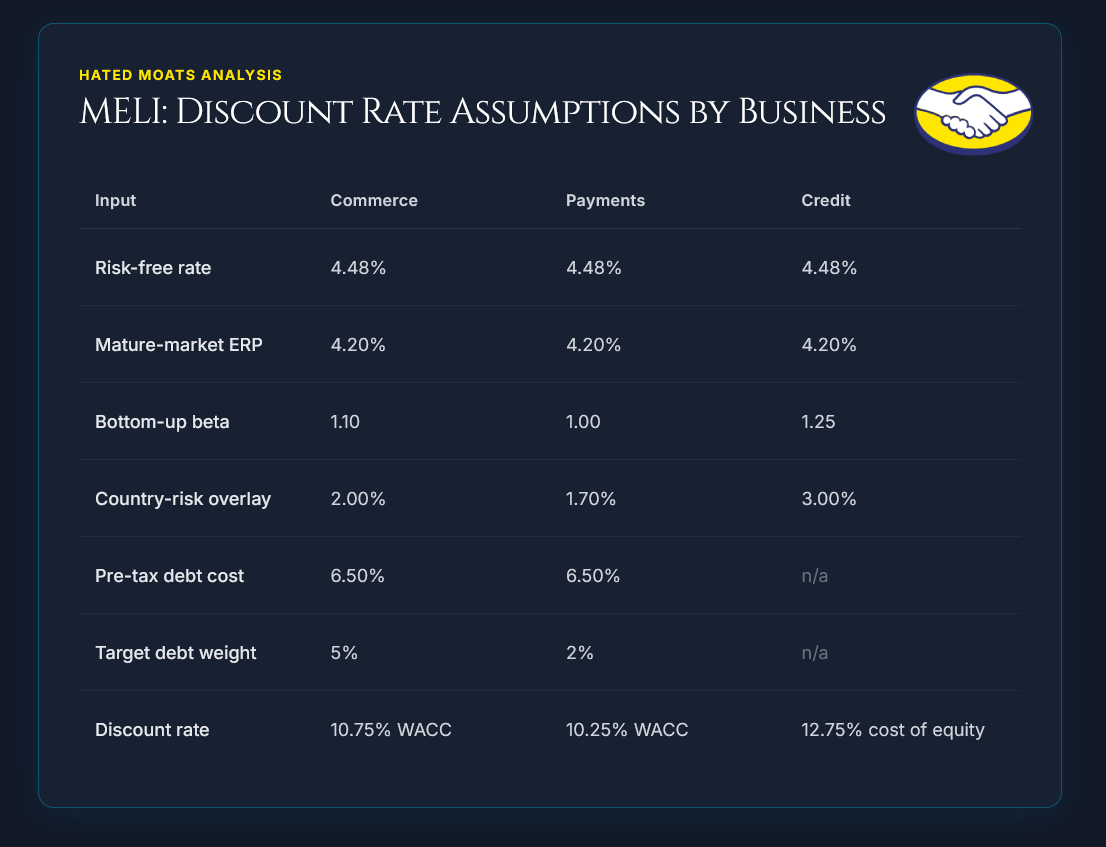
These rates sit between a developed-market valuation and a mechanical application of full country premiums. A revenue-weighted premium based only on Brazil, Mexico and Argentina would be approximately 4.2% before “Other countries”, but revenue is not a perfect measure of cash-flow exposure. MercadoLibre also generates revenue in local currencies and translates it into US dollars, while Argentina uses the USD as its functional currency because it’s highly inflationary.
The base case therefore applies partial country-risk overlays rather than ignoring regional risk or charging the full mechanical premium.
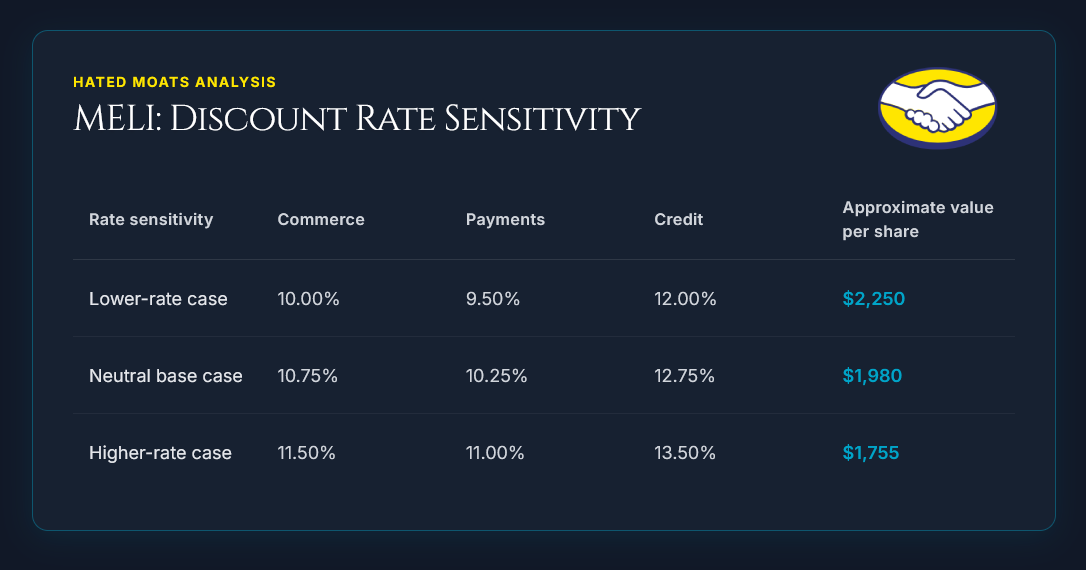
All 3 cases use the same operating forecasts and 3.5% terminal growth. The sensitivity shows that discount-rate selection can explain a significant share of the difference between conservative and bullish valuations.
Our valuation uses a 0.49-year stub from 6 July to year-end. Only forecast cash flow generated after the valuation date is included. Cash, debt and Credit equity should ideally be rolled forward from 31 March to the valuation date, although the likely effect is small relative to the operating-business values (and the extra analytical work required :).
6. Sum-of-the-Parts Results
Using the neutral discount rates, the 3 businesses produce approximately $100.0 billion of operating value:
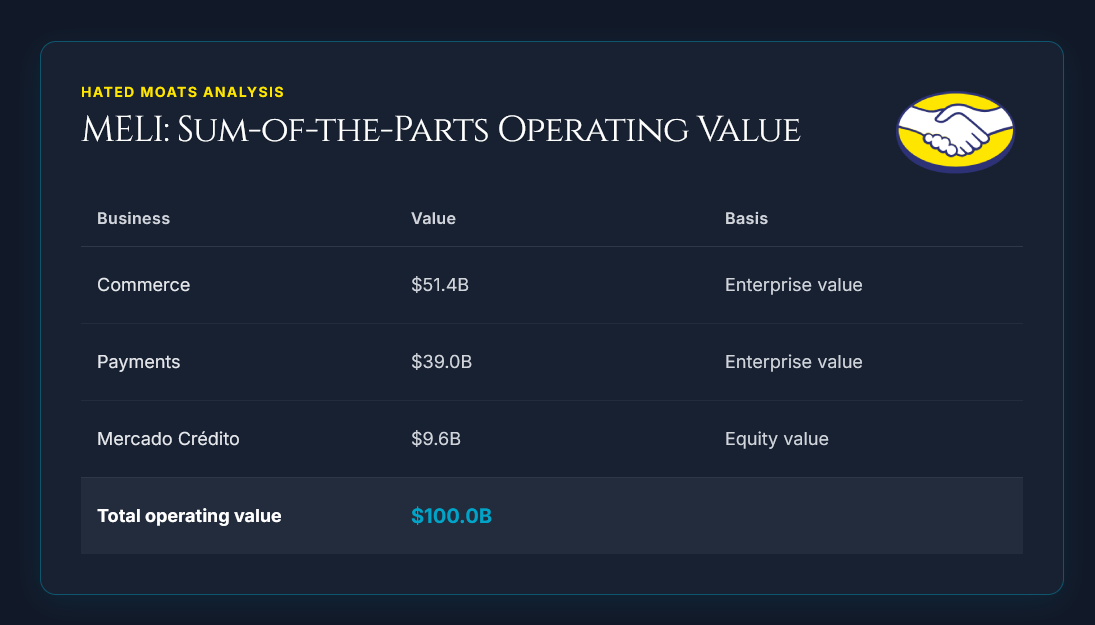
Credit is valued as equity because its funding and required capital are already included in the residual-income model.
Balance-Sheet Bridge
MercadoLibre reported $6.60B of available cash, investments and digital assets as of 31 March 2026. This management-defined non-GAAP liquidity measure excludes several restricted, pledged and securitisation-related items, making it a more useful starting point than total cash and investments for the equity bridge.
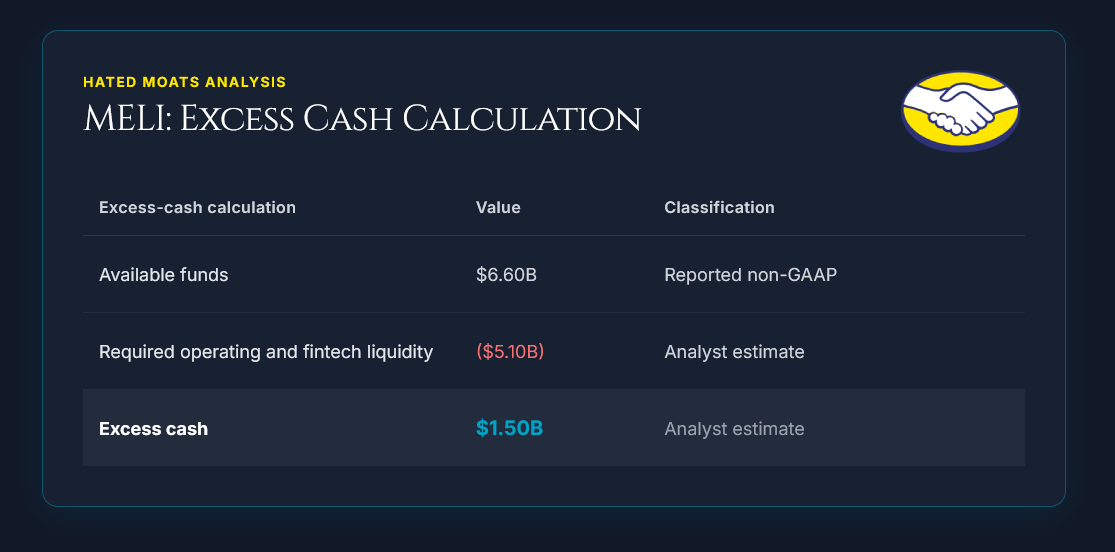
The $5.10B reserve represents estimated settlement, regulatory, working-capital and Credit liquidity requirements. Excess cash should also be tested at zero and $3 billion.
At the base-case share count, each additional $1.0 billion of excess cash changes value by roughly $20 per share. Testing excess cash at zero instead of $1.5 billion would reduce the base value by about $30 per share, while testing it at $3.0 billion would increase the base value by about $30 per share. This is meaningful, but much smaller than the impact of margins, discount rates or Credit returns.
The 2031 and 2033 notes had carrying values of approximately $537 million and $744 million. Their combined carrying value of approximately $1.28 billion is deducted in the bridge. The 2026 Sustainability Notes were repaid in January 2026.
Fintech funding and securitisation liabilities remain inside Payments and Credit and aren’t deducted again. Lease liabilities also aren’t deducted separately while lease expenses remain within segment EBIT.
Equity-Value Bridge
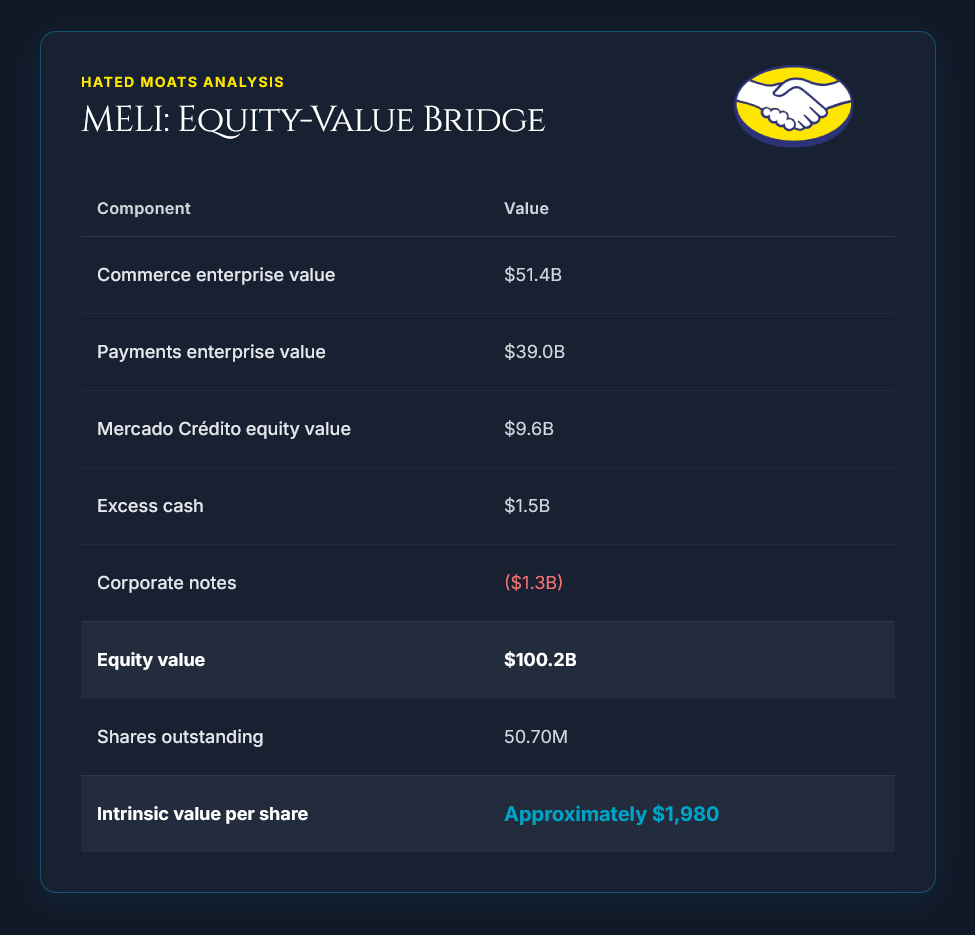
The share count is anchored to 50.697 million shares outstanding as of 7 May 2026.
Against the 9 July 2026 closing price of $1,807.83, the base case implies approximately 9.5% upside.
This suggests modest undervaluation, but not a wide enough margin of safety for a business whose standalone segment margins and capital allocations aren’t directly reported.
We don’t present probability-weighted value here because assigning precise probabilities to the bear, base and bull cases would introduce unnecessary false precision.
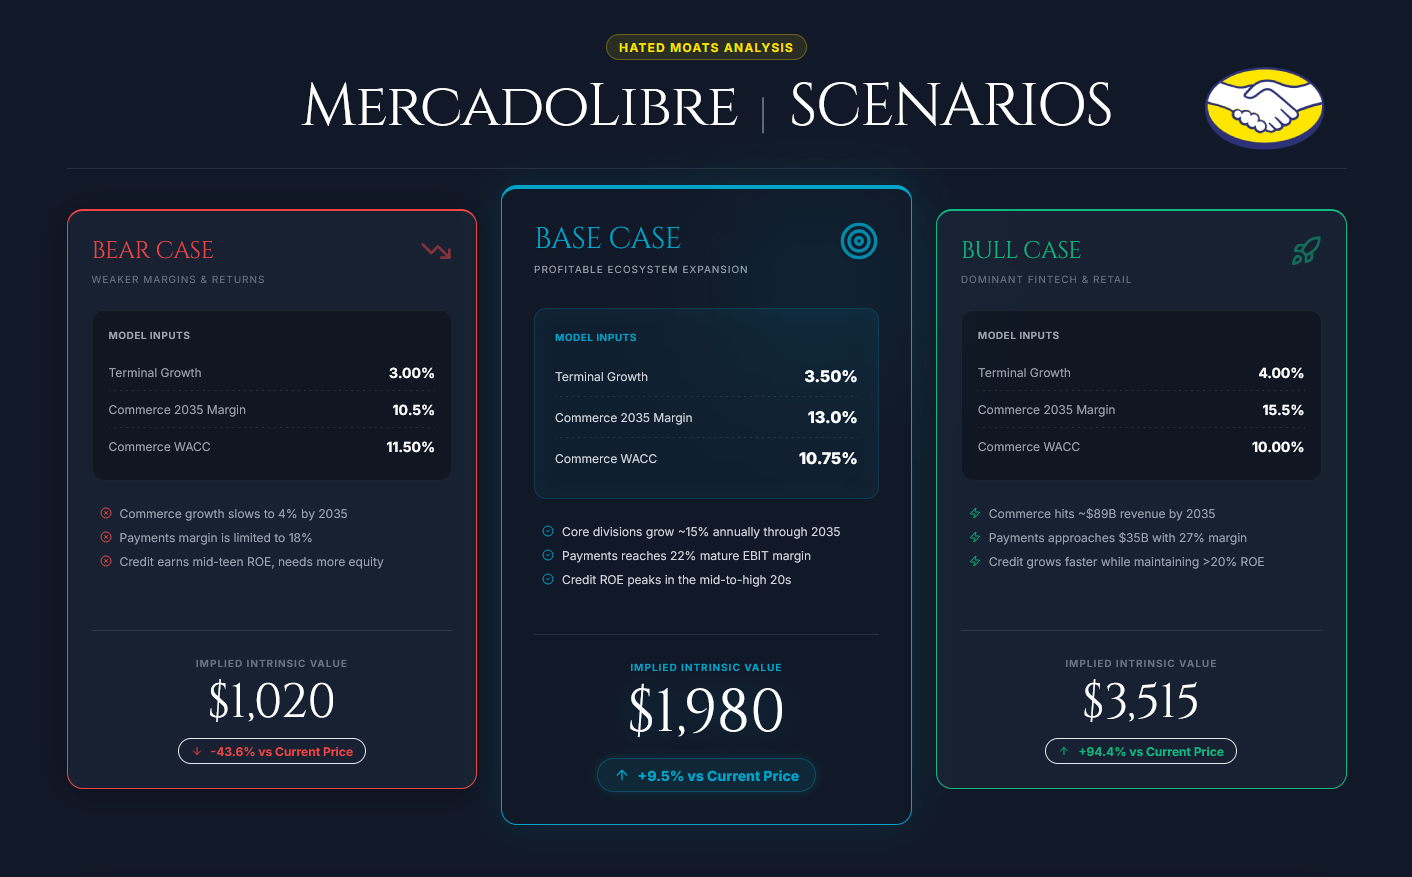
7. Bear, Base and Bull Scenarios
The scenarios combine changes in growth, margins, capital requirements and discount rates. They show plausible valuation boundaries rather than the effect of a single assumption.
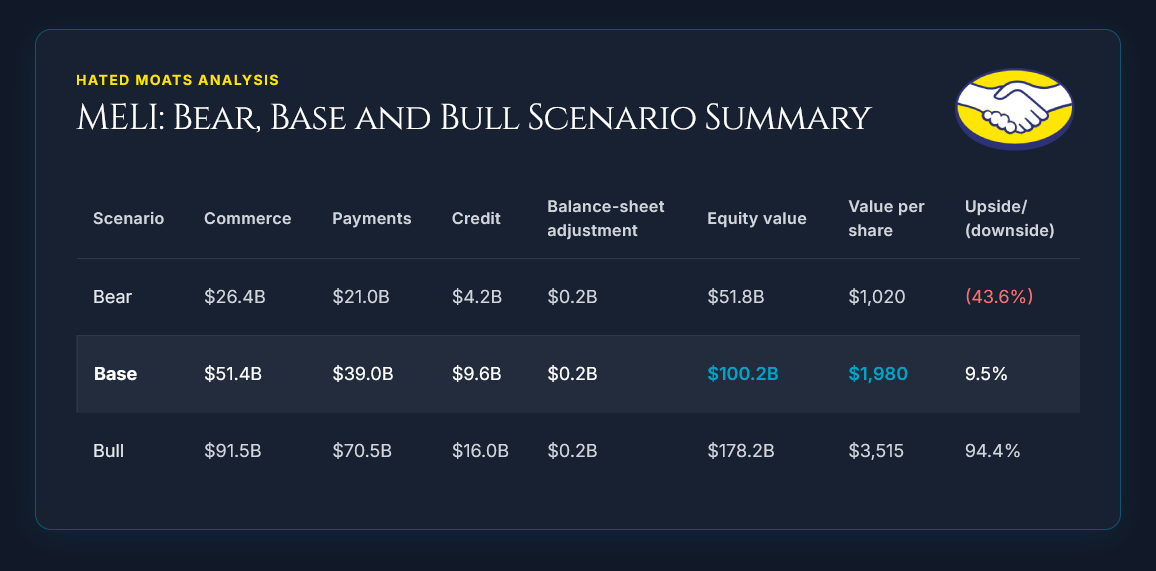
Bear Case: $1,020 per share
Commerce growth slows to 4% by 2035 and the mature EBIT margin reaches only 10.5%. Payments margin is limited to 18%, while Credit earns mid-teen ROE and requires more equity.
The Commerce and Payments WACCs rise to 11.5% and 11.0%, while Credit’s cost of equity reaches 13.5%. Terminal growth falls to 3%.
MercadoLibre remains a growing regional leader, but weaker margins and lower Credit returns reduce value to approximately $1,020 per share.
Base Case: $1,980 per share
Commerce and Payments grow by approximately 15% annually through 2035, reaching mature EBIT margins of 13% and 22%, respectively.
Credit ROE peaks in the mid-to-high 20s before declining as the portfolio matures, while required equity also falls over time. Neutral discount rates produce a value of approximately $1,980 per share.
Bull Case: $3,515 per share
Commerce revenue reaches approximately $89 billion by 2035 with a 15.5% EBIT margin. Payments approaches $35 billion of revenue and achieves a 27% margin.
Credit grows faster, requires less equity and maintains ROE above 20%. The Commerce and Payments WACCs fall to 10.0% and 9.5%, while Credit’s cost of equity declines to 12%. Terminal growth rises to 4%.
We believe the resulting value of approximately $3,515 per share is highly optimistic because it combines stronger growth, higher margins, lower capital requirements and lower discount rates. In other words, this is a scenario for proper MELI bulls. :)
The range highlights MercadoLibre’s operating leverage in both directions. Separate sensitivities for margins, rates and Credit capital are more informative than assigning exact probabilities to the 3 scenarios.
8. Conclusion
MercadoLibre is a high-quality commerce and fintech ecosystem, but Commerce, Payments and Credit require different valuation methods.
Using what we believe to be neutral discount rates, the sum-of-the-parts model produces a base value of approximately $1,980 per share. This represents about 9.5% upside from the $1,807.83 reference price.
Margin of Safety = 1 - (Current Price / Intrinsic Value)
Margin of Safety = 1 − ($1,807.83 / $1,980)
Margin of Safety = 8.7%
Based on our valuation scale, MELI becomes:
Undervalued below $1,683, representing a 15% margin of safety.
Deeply undervalued below $1,188, representing a 40% margin of safety.
Final Verdict: Farily Valued to Slightly Undervalued
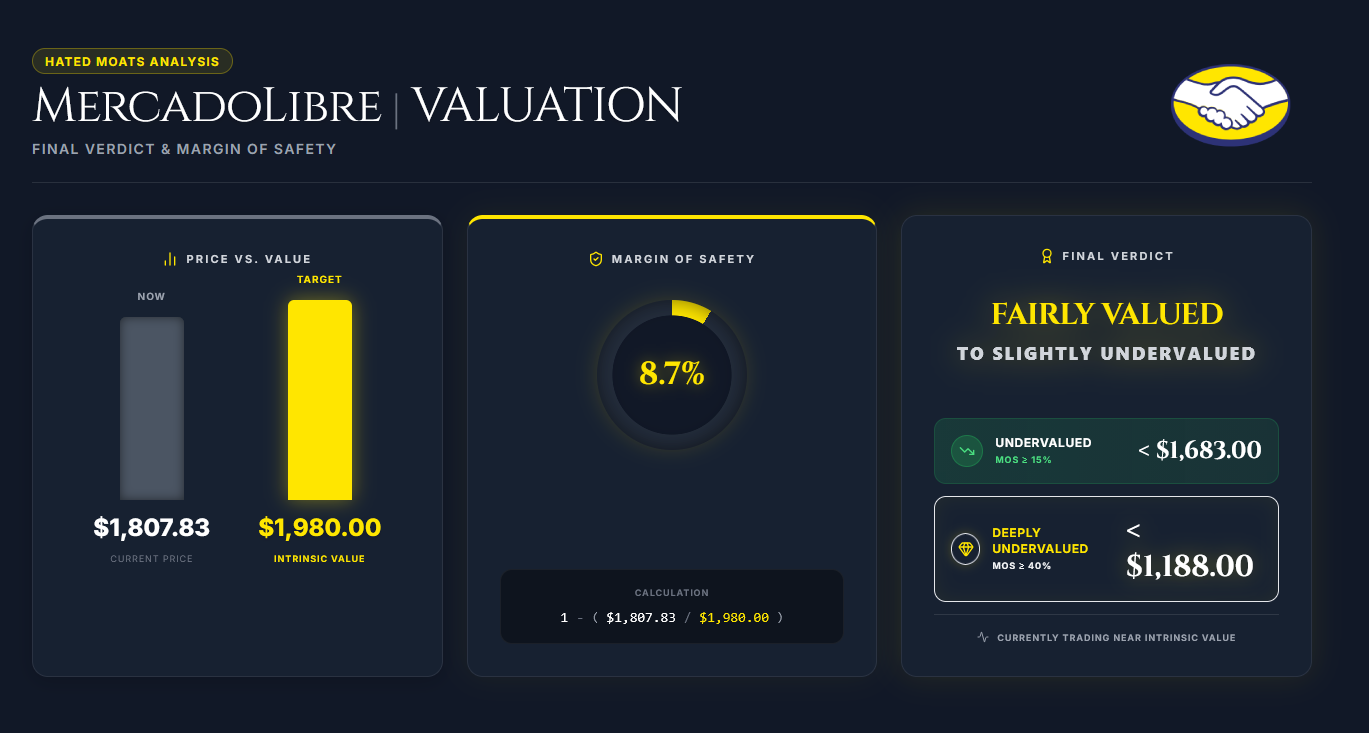
The result suggests that MercadoLibre is fairly valued but the daily swings currently (below $1,782) put it in our slightly undervalued category.
Stronger Commerce margins, higher Payments monetisation or better Credit economics could produce substantial upside. Conversely, weaker margins or higher capital requirements could materially reduce value without undermining MercadoLibre’s regional leadership.
The current price is just short of a 10% discount to our base value. That may be sufficient for investors with high confidence in MercadoLibre’s long-term execution (wonderful company at fair price), but it doesn’t provide a strong margin of safety against the uncertainty of our model.
Keep in mind that our valuation depends on analyst-defined segment assumptions because MercadoLibre doesn’t report Commerce, Payments and Credit as standalone businesses.
We could be too conservative if advertising, logistics density, Payments monetisation or Credit returns scale better than expected. On the other hand, we could be too optimistic if free shipping, first-party retail, logistics investment, credit losses or capital requirements weigh more heavily on margins and cash flow.
The biggest swing factors are mature margins, discount rates and the amount of equity capital required by Mercado Crédito.
The central investment question is whether Commerce and Payments can achieve the assumed mature margins while Credit continues earning returns comfortably above its cost of equity.
We will look closely at that and much more in our upcoming deep dive analysis.
Disclosure
This article is for informational purposes only and does not constitute investment advice or a recommendation to buy or sell any security.
What macroeconomic risks, such as interest rate fluctuations or currency volatility, does the valuation model account for, and how might these risks influence the assumptions about future growth and margins for MercadoLibre?
Great analysis, thx!