
Microsoft: DCF Valuation
Microsoft is exceptional but the stock is no bargain. Here's why. - DCFriday #013

Date of Analysis: April 6 - 10, 2026
Verdict: Fairly Valued with Undervalued Tilt
Current Price Target (Base Case): $422.15 per share
Price at the Time of Analysing: $370.87
1. Brief Overview
We all know Microsoft and we won’t make the article unnecessary longer. What we recommend to read further about is Microsoft, their AI game-plan, connection to OpenAI and the respective RPO, which we consider important.
Let’s look at the model!

2. Discounted Cash Flow (DCF): Assumptions & Methodology
2.1. Revenue Forecast (Years 1-10)
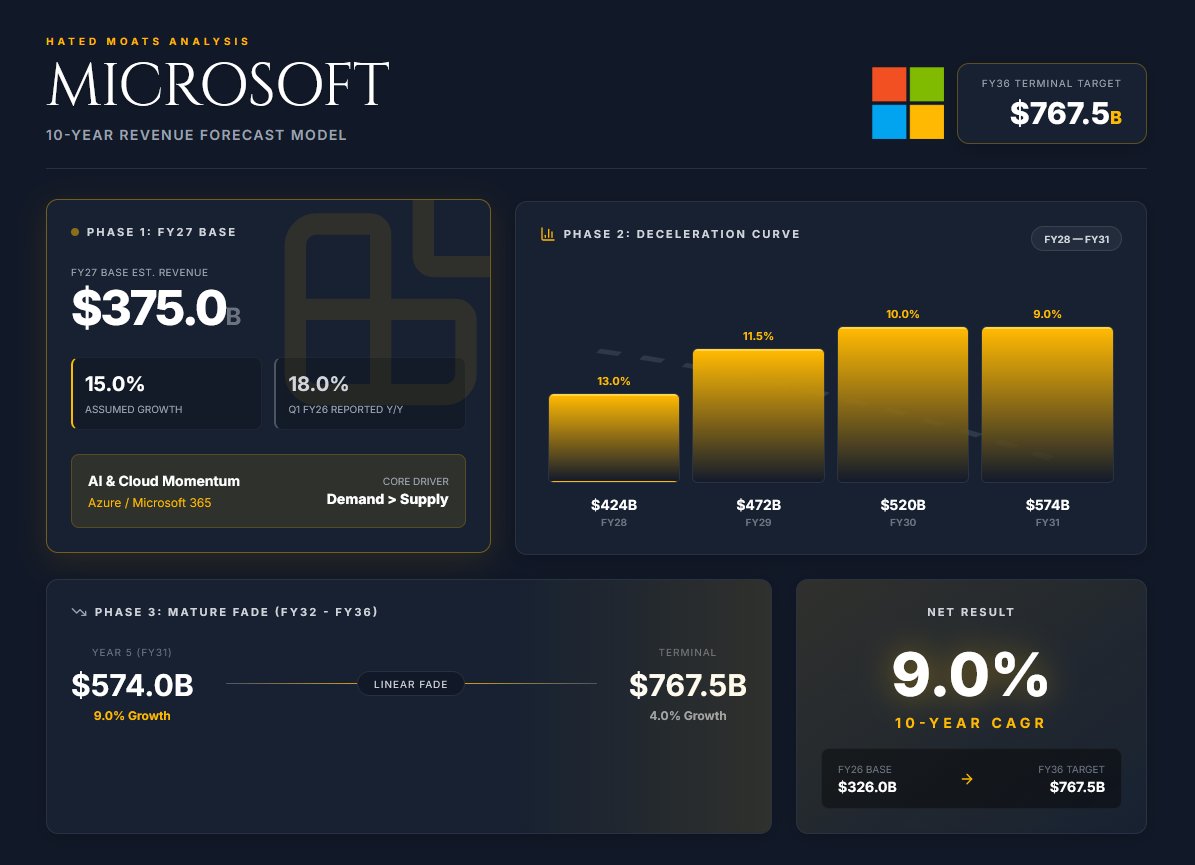
Year 1 (FY2027) Growth: 15%
We anchor FY2027 to Microsoft’s current FY2026 trajectory, using reported first-half results and third-quarter guidance rather than any single quarter. Microsoft reported revenue of $77.7B in Q1 FY2026, up 18% YoY and $81.3B in Q2 FY2026, up 17%. Management then guided Q3 FY2026 revenue to $80.65B to $81.75B, implying 15% to 17% growth, with Azure expected to grow 37% to 38% in constant currency. Against that backdrop, we assume a 15.0% FY2027 revenue assumption is reasonable, and should be characterised as the cautious end of current evidence rather than the midpoint of recent trends, which fits our mild conservative approach in methodology.
We believe this assumption allows for some normalisation in AI monetisation, contract timing, and enterprise deployment cycles, while still reflecting continued adoption across Microsoft 365, Azure, and broader AI and cloud workloads. Management’s commentary also supports a measured stance, as demand continues to exceed supply, but recent commercial indicators were also affected by a significant multi-year OpenAI contract, which is likely to create some quarterly volatility in bookings and RPO growth, and of which we are subjectively not as big fan of. Then again, we believe Microsoft will acquire / take over OpenAI once it caves in, but that’s not the topic of this article.
Years 2-5 (FY2028 - FY2031): Deceleration from 13% to 9%
We assume a measured deceleration through FY2031 as Microsoft grows into a materially larger revenue base and comparisons become more demanding. The core underwriting case here is not that growth remains exceptional indefinitely, but that Microsoft retains durable revenue support from enterprise entrenchment across Productivity and Business Processes and Intelligent Cloud, ongoing cloud migration, and a gradually rising contribution from higher-value AI workloads. Assuming FY2026 revenue lands at roughly $325B - $327B, which is consistent with reported Q1 and Q2 revenue, current Q3 guidance, and a reasonable Q4 assumption against FY2025 Q4 revenue of $76.4B, this path then implies revenue of approximately $572B to $576B by FY2031, so we believe the output is internally consistent.
Years 6-10 (FY2032-FY2036): Fading to 4%
In the outer forecast period, we fade growth linearly to 4.0% by FY2036. We assume this is acceptable as an exit-year growth assumption within the explicit forecast horizon, but it should not be conflated with the perpetual terminal growth rate thereafter (more on that below). Framed this way, our assumption recognises Microsoft’s scale, recurring revenue base, pricing power, and ability to monetise successive software and AI cycles, while still acknowledging that growth should converge meaningfully as the company matures further. On this basis, the implied 10-year revenue CAGR of about 9.0% and FY2036 revenue of roughly $765B - $770B are arithmetically consistent according to our calculations.
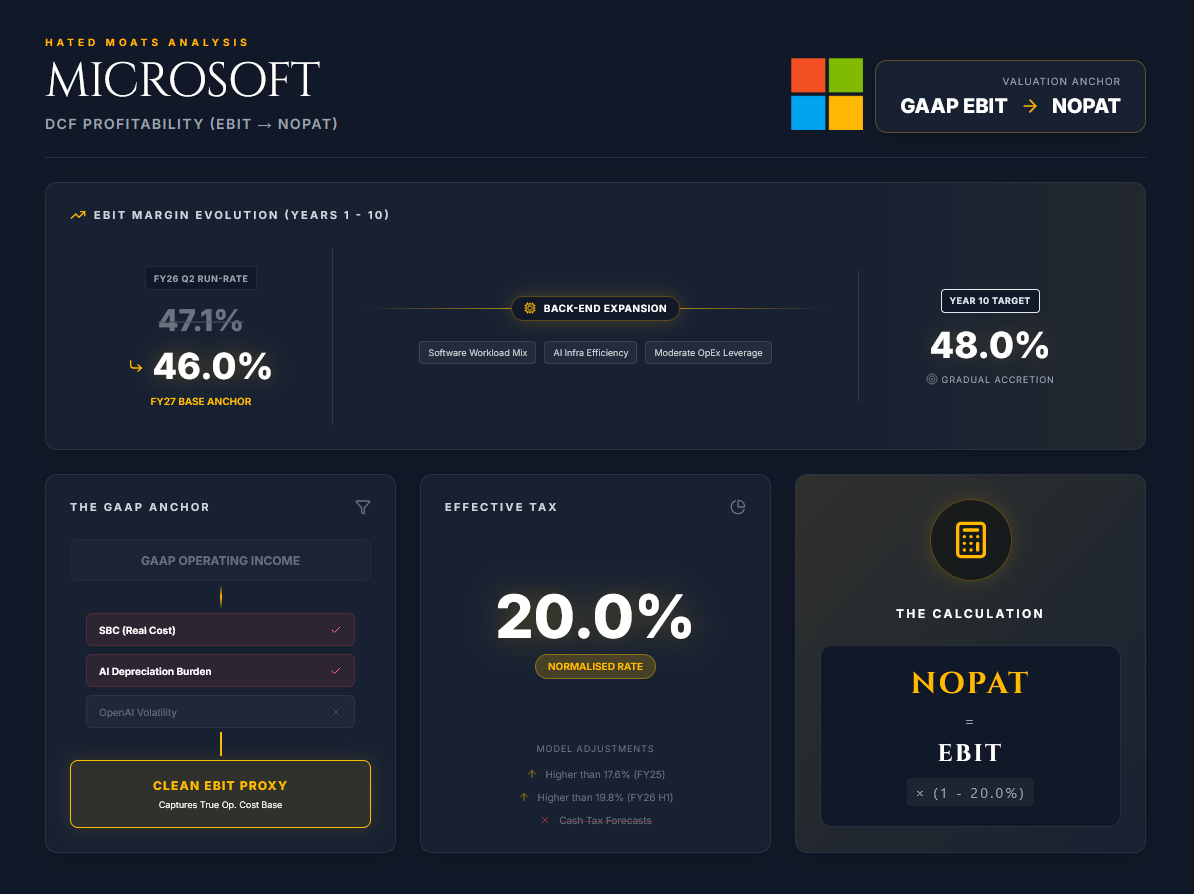
2.2. Profitability (EBIT → NOPAT)
We use GAAP operating income as our EBIT proxy. For the case of Microsoft, this is not a case of translating an adjusted operating profit into GAAP EBIT. In FY2026 Q2, the non-GAAP adjustment disclosed by management related to gains and losses on OpenAI investments below operating income, rather than to operating income itself. Using GAAP operating income therefore captures the operating cost base, including stock-based compensation (SBC) and the depreciation burden associated with AI infrastructure, while excluding non-operating investment volatility.
Start EBIT margin: 46%
Microsoft’s trailing 12-month operating margin at 31 December 2025 was approximately 46.7%, based on operating income of roughly $142.6B on revenue of roughly $305.5B across FY2025 Q3, FY2025 Q4, FY2026 Q1, and FY2026 Q2. FY2026 Q2 operating margin was 47.1%. We therefore model a modest step-down to 46.0% in FY2027 to reflect continued AI data centre expansion, higher depreciation and compute-related costs, and some near-term pressure from infrastructure scaling. This is quite cautious relative to the current run-rate, although it is still slightly above Microsoft’s FY2025 full-year operating margin of 45.6%, so we see it better characterised as a measured normalisation assumption than as an outright conservative reset.
Long-run margin path: Expands to 48% by Year 10
We model gradual EBIT margin expansion to 48.0% by Year 10. The key drivers are moderate operating leverage, mix improvement towards higher-value software and cloud workloads, and efficiency gains as AI infrastructure is more fully utilised over time. We don’t rely on an assumed 60% to 70% plus incremental margin for AI services, as Microsoft doesn’t disclose such a figure and current evidence still points to near-term margin pressure rather than immediate accretion. Microsoft Cloud gross margin declined from 70% to 67% YoY in FY2026 Q2, driven by continued investments in AI infrastructure and growing AI product usage. Accordingly, our margin expansion here is gradual and back-end loaded rather than front-loaded.
Tax rate: 20%
For NOPAT, the relevant assumption is a normalised operating tax rate rather than a cash tax rate. Microsoft’s effective tax rate was 17.6% in FY2025, while the reported rate for the first half of FY2026 was approximately 19.8%. Management’s tax guidance around that period was also about 19% on an adjusted basis. We thus apply a 20.0% tax rate to EBIT throughout the explicit forecast period. This is slightly above the recent run-rate, but we believe it avoids mixing cash tax assumptions with an accrual-based NOPAT framework, and it’s conservative without becoming unnecessarily punitive.
NOPAT calculation
NOPAT = EBIT x (1 - tax rate)
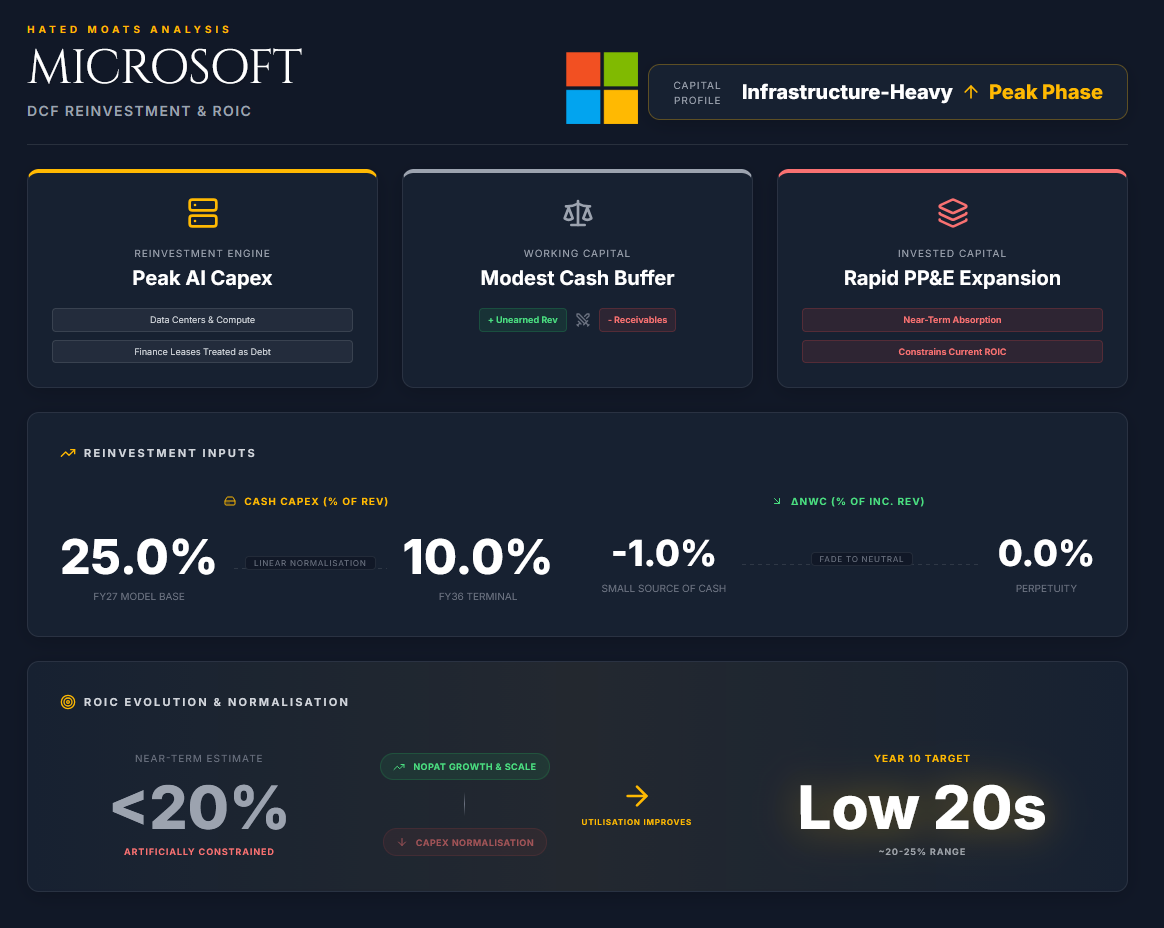
2.3. Reinvestment & ROIC
Microsoft is currently operating through an unusually capital-intensive phase as it builds out AI and cloud infrastructure, even though the underlying software and subscription businesses remain structurally in the high return category. The key modelling distinction is between temporary peak infrastructure investment and the longer-run earning power of the franchise.
Capex
We model cash capex at 25% of revenue in FY2027, declining linearly to 10% by FY2036. This should be understood as a normalised cash capex assumption for FCFF rather than a proxy for Microsoft’s current total reinvestment intensity. In FY2025, additions to property and equipment were $64.6B, equal to 22.9% of revenue. By contrast, management reported total capital expenditure of $34.9B in FY2026 Q1, including $11.1B of finance leases and $19.4B of cash paid for PP&E. In FY2026 Q2, total capital expenditure increased further to $37.5B, with $29.9B of cash paid for PP&E and $6.7B of finance leases. We therefore treat FY2027 as the beginning of a partial normalisation from peak infrastructure spending rather than an extrapolation of current quarterly intensity. In the DCF, finance lease additions should be treated consistently as debt-like financing and reflected in invested capital and the EV bridge, rather than double-counted in FCFF, so we proceed in this very manner.
Net Working Capital (NWC)
Microsoft benefits from efficient collections and material contract liabilities, which support cash conversion, but we believe this advantage should be treated as broadly neutral to modest rather than as a dependable annual source of cash. Total unearned revenue was $67.3B at 30 June 2025 and $54.0B at 31 December 2025, which illustrates that the balance is meaningful but also seasonal. We therefore model ΔNWC as only a small source of cash in the earlier forecast years, fading to 0% in the terminal phase.
ROIC (Return on Invested Capital)
We don’t rely on a precise current ROIC point estimate, because the outcome is highly sensitive to how invested capital is defined during a period of unusually heavy infrastructure deployment. Instead, we assume Microsoft remains a high-return business over time, but that aggregate ROIC is constrained in the near term by the rapid expansion of the capital base. Net PP&E increased to $261.1B at 31 December 2025 from $205.0B at 30 June 2025, underscoring the extent of current capital absorption. As utilisation improves and capex normalises, returns should recover, but we dont assume unusually high incremental returns on AI reinvestment or aggregate ROIC materially above the low 20s by Year 10. We believe that a low-20s long-run ROIC is more objective and more consistent with the scale of current investment.
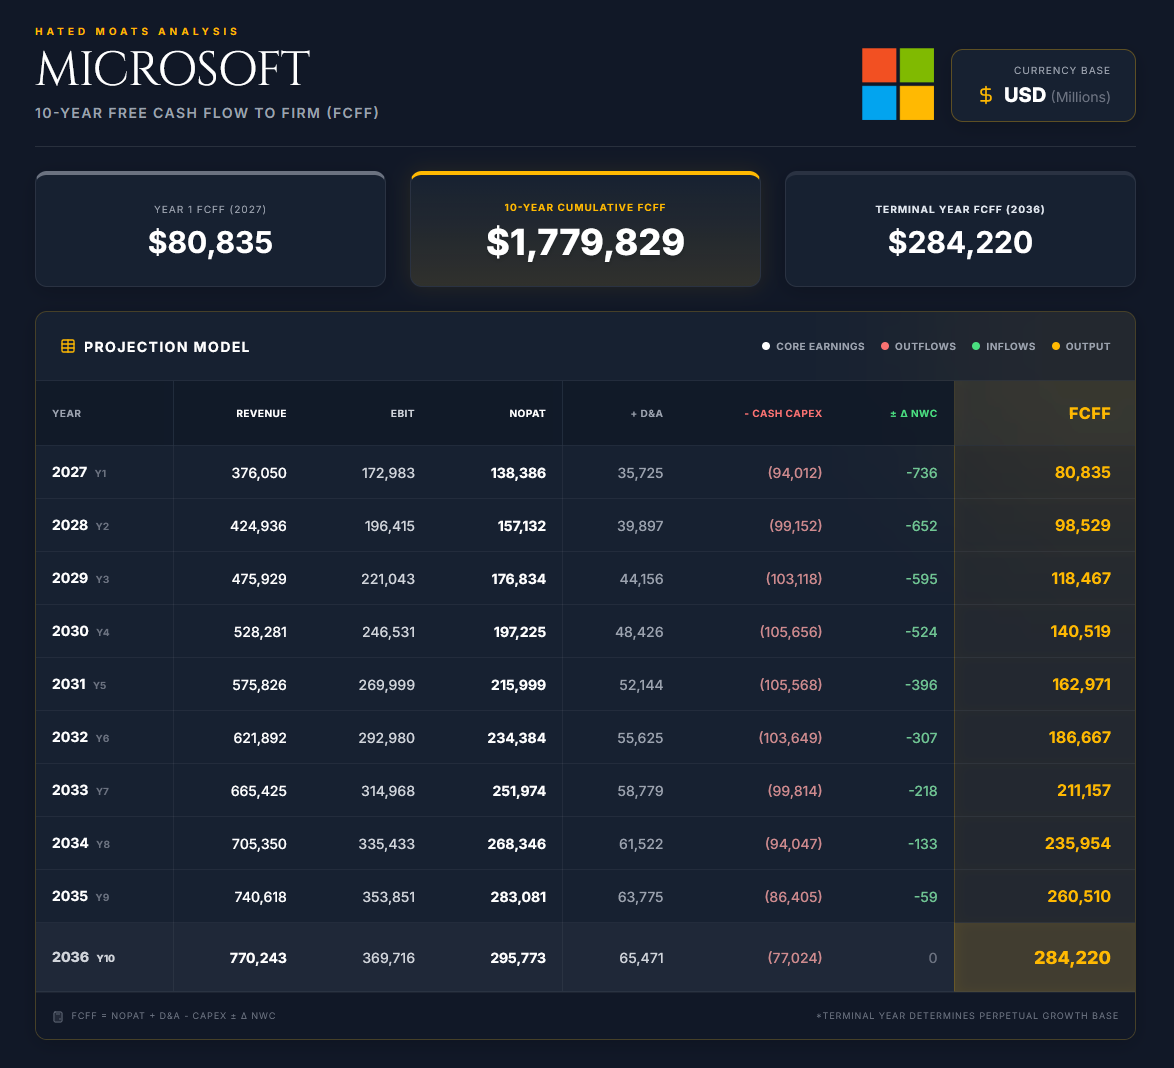
2.4. Free Cash Flow to the Firm (FCFF)
The formula used is:
FCFF = NOPAT + D&A - Cash Capex - ΔNWC
2.5. Discount Rate (WACC)
The weighted average cost of capital is the discount rate applied to forecast FCFF. We construct it using market-based inputs as of 8 April 2026 and align the tax treatment with the 20.0% operating tax rate used in the NOPAT forecast.
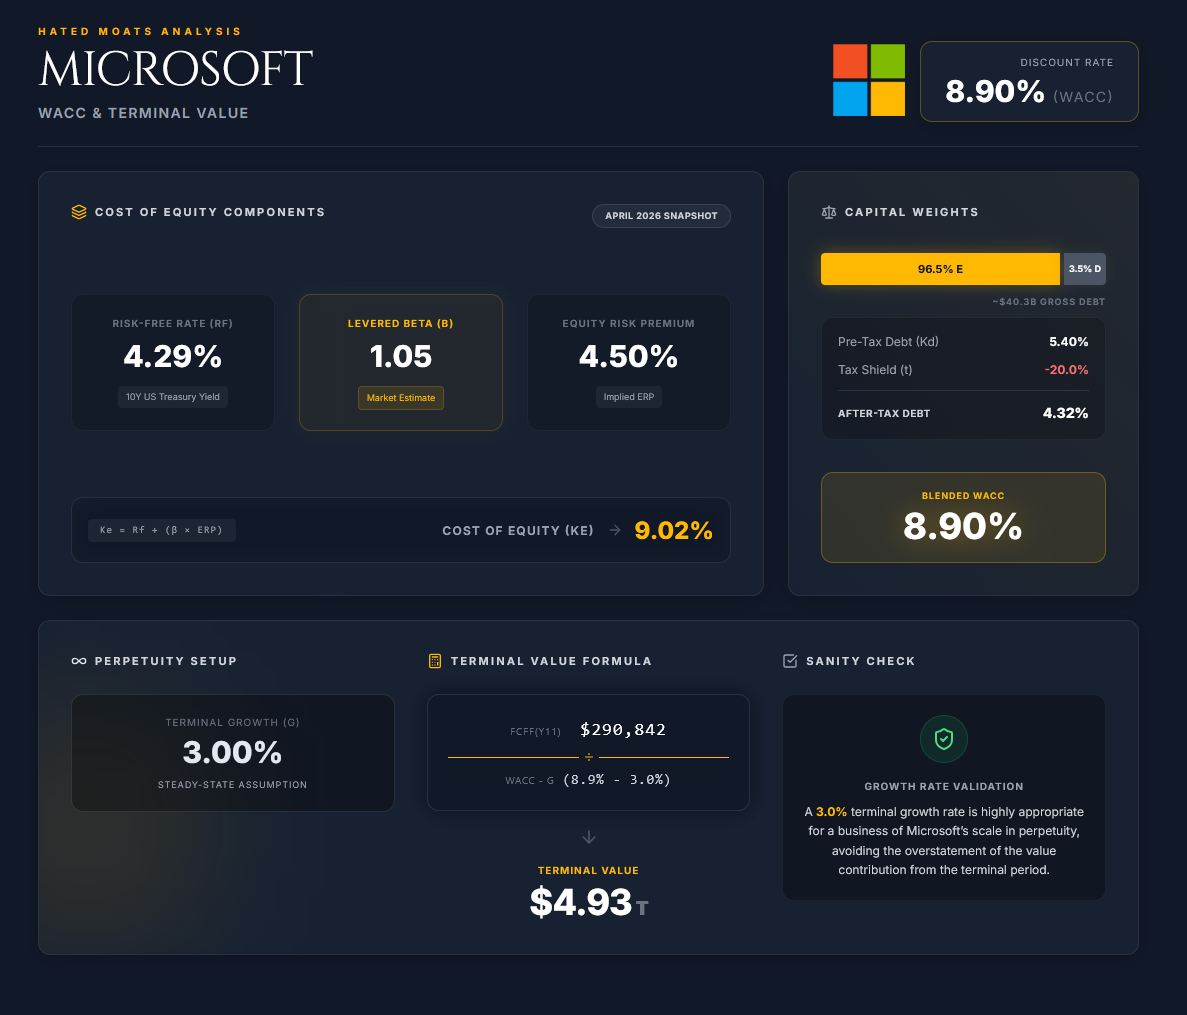
Risk-Free Rate (Rf): 4.29%
We use 4.29% for the US 10-year Treasury, which is the published 10-year constant maturity yield for 8 April 2026.
Equity Risk Premium (ERP): 4.50%
Beta (β): 1.05
Cost of Equity (Ke)
Ke = Rf + β x ERP
Ke = 4.29% + 1.05 x 4.50% = 9.02%
Pre-Tax Cost of Debt (Kd): 5.40%
Microsoft continues to carry top-tier credit ratings, including Aaa from Moody’s, so using the 8 April 2026 Moody’s Aaa spread of 1.11% over the 10-year Treasury is a reasonable market-based proxy. We assume that combined with the 4.29% Treasury yield, this implies a pre-tax cost of debt of 5.40%, as showed above.
Tax Shield: 20.0%
For consistency with the operating forecast, we apply the same 20.0% tax rate used in the NOPAT calculation.
After-Tax Cost of Debt
Kd x (1 - t) = 5.40% x (1 - 0.20) = 4.32%
Capital Structure
At $374.33 per share on 8 April 2026 and 7,429 million shares outstanding, Microsoft’s equity value was about $2.78 trillion. Gross interest-bearing debt at 31 December 2025 was about $40.3B, comprising current portion of long-term debt and generally long-term debt. Microsoft also disclosed material finance lease liabilities in the lease footnote. Using only funded debt implies a capital structure of roughly 98.6% equity and 1.4% debt, while including finance lease liabilities as debt-like financing implies roughly 96.5% equity and 3.5% debt. Because Microsoft is overwhelmingly equity financed, either treatment leads to effectively the same rounded WACC. For consistency with the reinvestment section, we use the latter, broader debt-like view that includes finance leases:
WACC Computation
WACC = (0.965 × 9.02%) + (0.035 × 4.32%) = 8.85%
Our final used WACC = 8.9%
2.6. Terminal Value
We calculate terminal value using the perpetuity growth method. Our 4.0% assumption is treated as the final year growth rate within the explicit forecast, not the perpetual growth rate thereafter. For the terminal value itself, we use 3.0%.
Terminal Growth Rate (g): 3.0%
We believe this rate is more appropriate for a business of Microsoft’s scale in perpetuity and avoids overstating the value contribution of the terminal period.
Formula used:
TV = FCFF(n+1) / (WACC - g)
The calculation is as follows:
FCFF(Y11) = FCFF(Y10) x (1 + g) = 282,371 x 1.03 = 290,842
TV = 290,842 / (0.089 - 0.030) = 290,842 / 0.059 = $4,929,528 million
3. Results
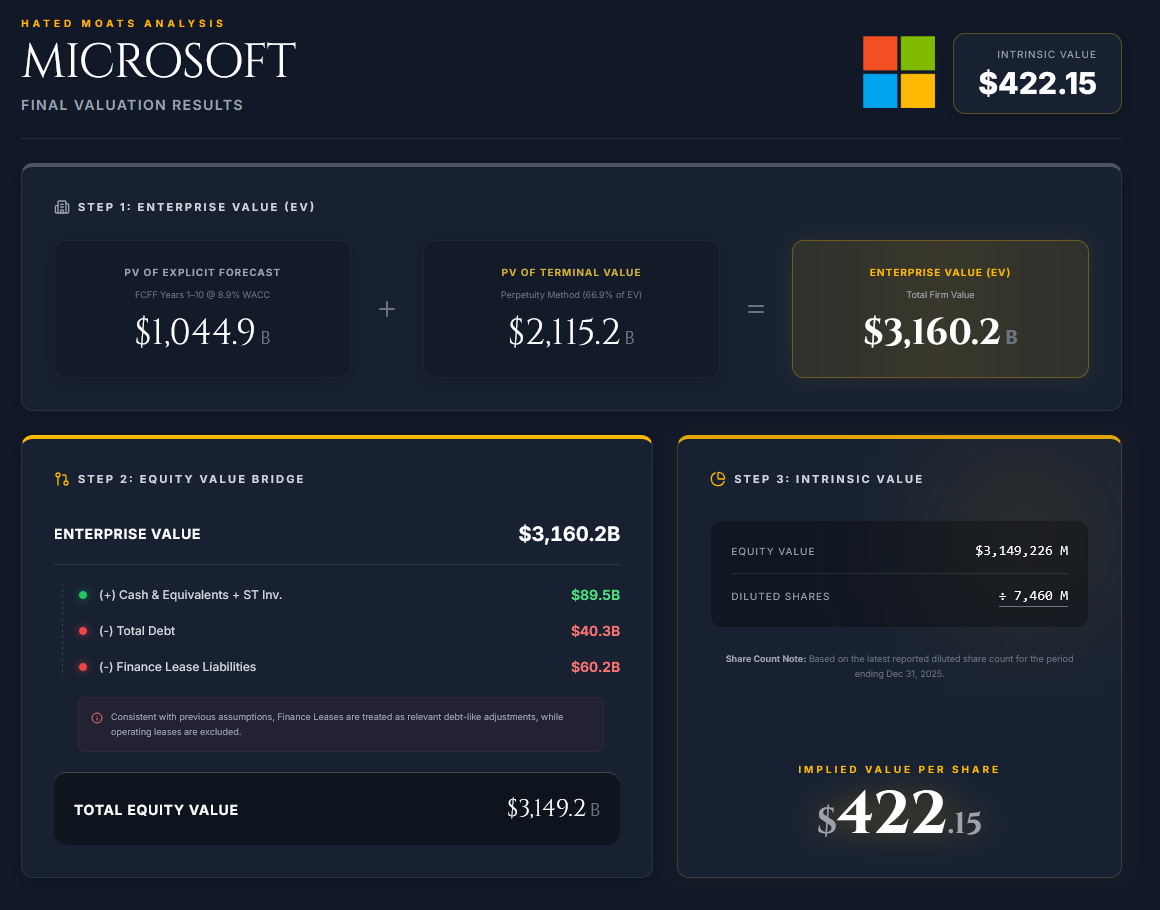
We sum the present value of the explicit forecast period FCFF and the present value of the terminal value to arrive at enterprise value.
Using a WACC of 8.9%, the present value of forecast FCFF for FY2027 to FY2036 is $1,044,930 million.
Using a perpetual growth rate of 3.0%, the terminal value at FY2036 is $4,961,807 million, and its present value is $2,115,247 million.
This results in an enterprise value of $3,160,177 million.
The terminal value represents approximately 66.9% of total enterprise value, which is significant but we believe it’s materially defensible in our model.
Equity Value Bridge
For the equity bridge, we use Microsoft’s latest reported balance sheet as of 31 December 2025. The key consistency point is that finance lease liabilities should be treated as the relevant debt-like adjustment here, not operating lease liabilities, because finance leases have already been treated as debt-like previously in our model.
Enterprise Value: $3,160,177 million
(+) Cash, cash equivalents, and short-term investments: $89,462 million
(-) Total debt: $40,262 million
(-) Finance lease liabilities: $60,151 million
Equity Value: $3,149,226 million
Intrinsic Value per Share
Diluted share count: 7,460 million
Intrinsic Value per Share = 3,149,226 / 7,460 = $422.15 per share
4. Scenarios
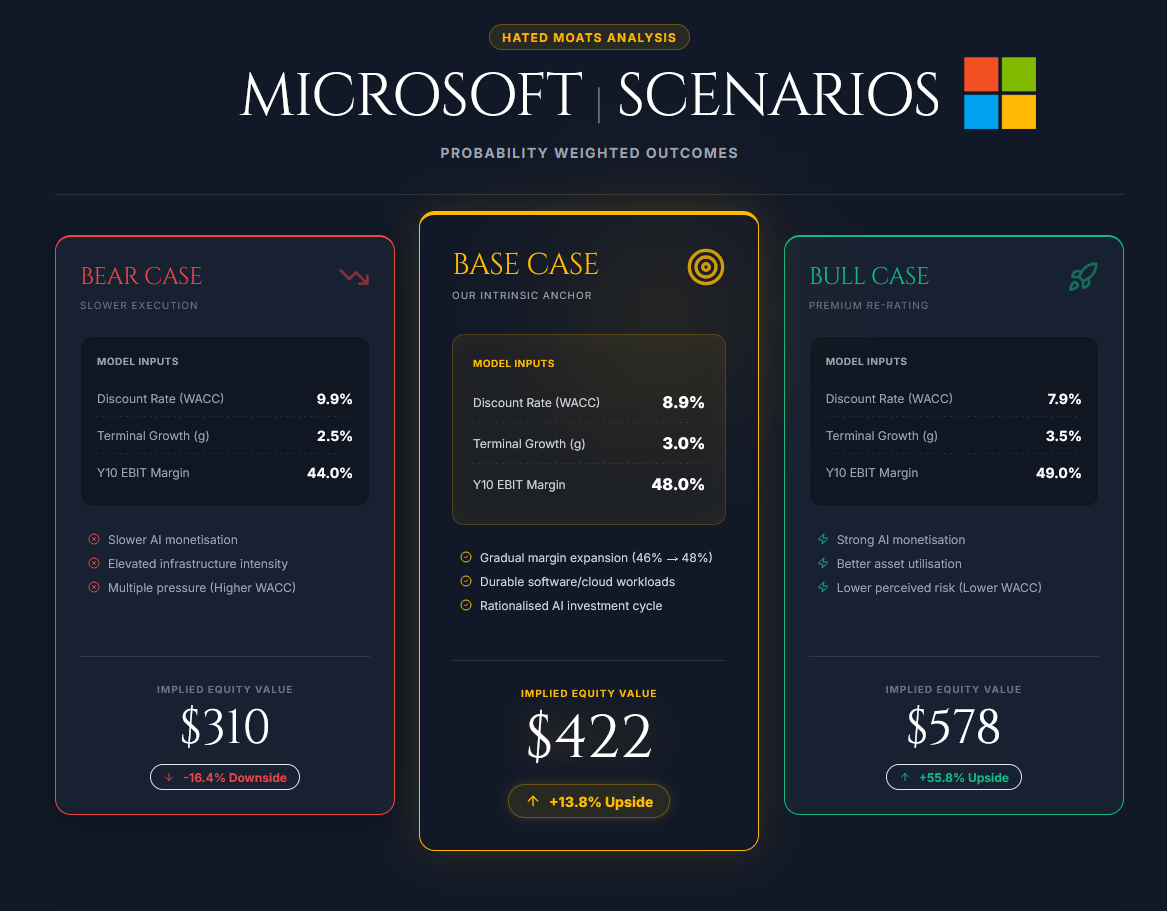
Bear case: $310 per share
Inputs: This case assumes a WACC of 9.9%, perpetual growth of 2.5%, and a weaker operating outcome in which EBIT margin trends from 45.0% to 44.0% rather than expanding. The result reflects a world where AI monetisation proves slower, infrastructure intensity stays elevated, and valuation multiples remain under pressure from a higher discount rate.
Outcome: At the current price (April 10, 2026 close), this signals a -16.4% downside in the bear case.
Base case: $422 per share
Inputs: This case represents our model as presented above, with WACC of 8.9%, perpetual growth of 3.0%, and EBIT margin expanding gradually from 46.0% to 48.0% by Year 10.
Outcome: This represents a +13.8% upside from the current price.
Bull case: $578 per share
Inputs: This case assumes a WACC of 7.9%, perpetual growth of 3.5%, and EBIT margin expanding from 46.5% to 49.0% over the forecast period. It reflects strong AI monetisation, better asset utilisation, and lower perceived risk.
Outcome: The bull case represents +55.85% upside from the current price of $370.87
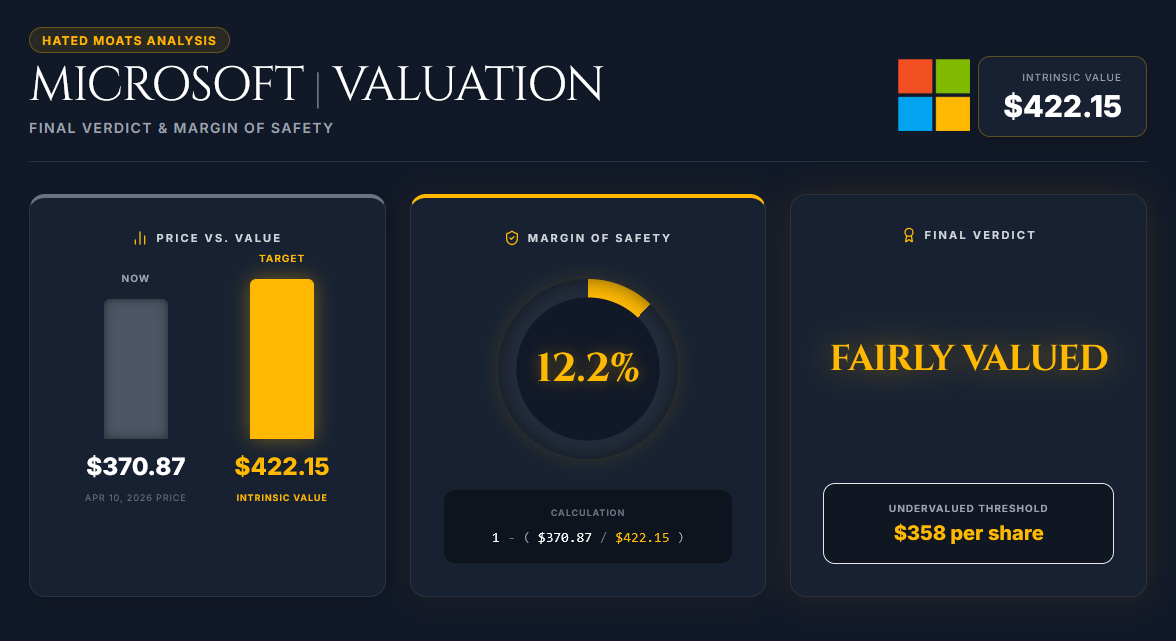
5. Conclusion: Margin of Safety & Final Verdict
Margin of Safety = 1 - (Current Price / Intrinsic Value)
Margin of Safety = 1 - ($370.87 / $422.15) = 12.2%
An 12.2% margin of safety doesn’t meet our threshold for an undervalued classification, where undervalued requires at least 15%. The conclusion is therefore that Microsoft is fairly valued, closed to being modestly undervalued rather than deeply mispriced.
The market is not obviously mispricing Microsoft as merely a capital-heavy AI infrastructure play. We believe that a more balanced reading is that the market is weighing 2 realities at once. First, Microsoft remains one of the highest-quality enterprise software and cloud franchises globally. Second, the near-term economics of the AI buildout are still burdened by unusually heavy capital intensity, higher depreciation, and some uncertainty around monetisation timing. That tension makes a premium valuation reasonable, but it does not justify calling the shares materially undervalued on the basis of our model alone.
The same caution, in our view, applies to the backlog argument. Microsoft disclosed commercial remaining performance obligation of $625B in FY2026 Q2, which is undeniably substantial, but approximately 45% of that balance was tied to OpenAI and only roughly 25% is expected to be recognised as revenue over the next 12 months. That makes RPO supportive of demand visibility, but not a clean proxy for broad-based, near-term monetisation across the full franchise.
Likewise, oure projected path to more than $280B of annual FCFF should be treated as a long-range model output for FY2036 rather than as present economic evidence.
In other words, Microsoft still screens as an exceptional business, but not as a clear bargain. We believe that the more objective conclusion is that Microsoft is a high-quality compounder trading around fair value, with upside dependent on better-than-modelled AI monetisation, faster capex normalisation, or a lower sustained cost of capital.
Final verdict: Fairly Valued with Undervalued Tilt
Our Strategy
Since the average price of our position in MSFT is quite low (and dates back to 2017), we do not buy shares at the current prices.
Microsoft enters undervalued territory: $358 per share
We definitely buy, should this price be reached: $335
In this fashion, we sold a put option at the mentioned strike price of $335 for June 18, 2026 expiration date, which netted us a premium of +$735, and now we’ll wait if we get quite a big purchase of 100 shares. :)
Disclosure
The author of this article does hold a position in the security of MSFT 0.00%↑ with the average price of $287.86 $69.83 (originally wrong input from excel, sorry!) at the time of publishing this valuation and has sold a put option with strike price of $335 with expiration date of June 18, 2026. This article is for informational purposes only and does not constitute investment advice or a recommendation to buy or sell any security.
Thanks for the read!
I believe the average price you put in the disclosure (280$) is not correct! (Or at least not coherent with your portfolio article 😉)
My price target is 525 here, but that is based on average of DCF + EBITDA exit. DCF itself also shows more grounded 430.