
MO-BRUK: DCF Valuation
A one-off hit has this company priced as broken. But is this permit-moat cash machine undervalued? - DCFriday #006

Date of Analysis: December 27, 2025 - January 2, 2026
Verdict: Undervalued
Current Price Target (Base Case): PLN 451
Price at the Time of Analysing: PLN 330
Note: zł = Polish złoty (PLN), as of January 2, 2026: 1 USD = 3,59 PLN
1. Brief Overview
Mo-Bruk S.A. (“Mo-Bruk” / “the Group”) is a Polish company that can be described as a high-margin, regulatory-privileged hazardous waste processor trading at a discounted valuation after a transient, backward-looking event distorted reported results.
The core issue is that Q3 2025 was optically “ugly” due to a one-off, non-recurring write-down of PLN 65.2m (~$18m) tied to a historical dispute over environmental fees (2018–2019). The market has priced this as if it permanently impairs the business model. Our view is the opposite. The forward cash-generation capacity of Mo-Bruk’s assets remains intact, while the regulatory environment is turning increasingly favourable for licensed, scaled operators.
Operationally, the engine is still running hot, so to speak. “Core Business” EBITDA margins recovered to 49% in Q3 2025, nearing management’s long-term target of 50%, which is a truly impressive number. Meanwhile, Poland is entering a state-funded clean-up super-cycle targeting illegal hazardous waste dumps (“ecological bombs”), with PLN 300m ($83.66m) per year ring-fenced through 2027, plus additional targeted funding via NFOŚiGW (National Fund for Environmental Protection and Water Management). Mo-Bruk, as a dominant holder of scarce incineration permits and proprietary solidification capability, effectively holds a “call option” on this spend. Poland as a whole is becoming a booming economy and for us represents an overall great environment to seek for investment opportunities.
Our 10-year FCFF DCF model yields a base-case intrinsic value of PLN 451 per share, implying +36.7% upside from PLN 330.

2. Business & Financial Context
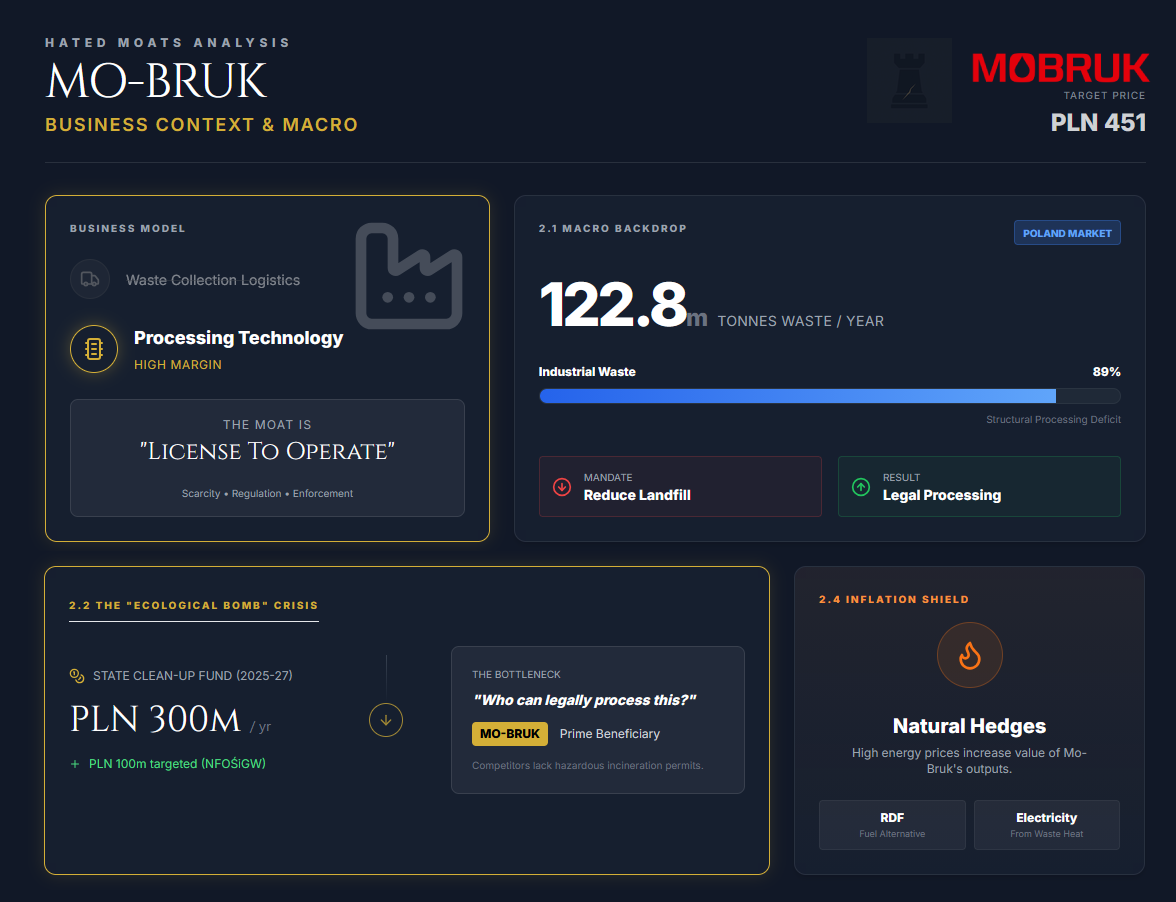
Mo-Bruk is not a waste collection company. It is a waste processing and treatment technology company operating in a sector where the “license to operate” literally is the moat. The addressable opportunity is shaped less by free-market dynamics and more by regulation, permitting scarcity, and enforcement.
2.1 Macro & Regulatory Backdrop
Poland produces ~122.8m tonnes of waste annually, with ~89% being industrial waste. The market suffers from a structural deficit in hazardous processing capacity, historically masked by landfilling and illegal dumping.
The EU being EU, its Circular Economy policy direction pressures landfilling down (municipal landfill share mandated below 10% by 2035), shifting volumes from cheap disposal to expensive treatment (incineration / recycling). At the same time, tightening enforcement tools reduce “grey zone” leakage and funnel more volume into legal channels where Mo-Bruk operates.
2.2 The “Ecological Bomb” Crisis
Poland’s illegal hazardous dumps (“ecological bombs”) are now being addressed with systemic financing. From January 1, 2025, amendments to the Waste Act created central funding support for removal.
PLN 300m ($83.66m) annually (2025–2027) allocated from a central budget reserve for clean-ups
Additional PLN 100m ($27.9m) via NFOŚiGW for 14 specific municipal locations
This shifts the bottleneck from “who will pay?” to “who can legally and safely process the waste?”. Mo-Bruk is the answer to this question, and the company is positioned as a prime beneficiary due to its scale and permits. Competitors without hazardous waste incineration permits are structurally disadvantaged (often forced into subcontracting).
2.3 EU Policy Tailwinds/Headwinds (ETS)
There is a longer-dated risk discussion around including waste incineration in ETS by 2028–2030. Even if this occurs, hazardous waste incineration demand is structurally inelastic (few legal alternatives). The “polluter pays” principle supports pass-through economics, meaning margin impact should be far more muted than for municipal waste-to-energy operators. This represents a good outlook for the company’s future.
2.4 Inflation & Energy
Cost inflation matters, but Mo-Bruk has partial natural hedges. It produces Refuse Derived Fuel (RDF) and electricity from waste heat (ORC modules). High energy prices increase the value of its outputs and support pricing power, especially as cement producers substitute coal with alternative fuels to reduce their ETS burden. Poland as a country, as mentioned above, is really in an admirable “growth” phase and this includes an effective fight against inflation.
3. Discounted Cash Flow (DCF): Assumptions & Methodology
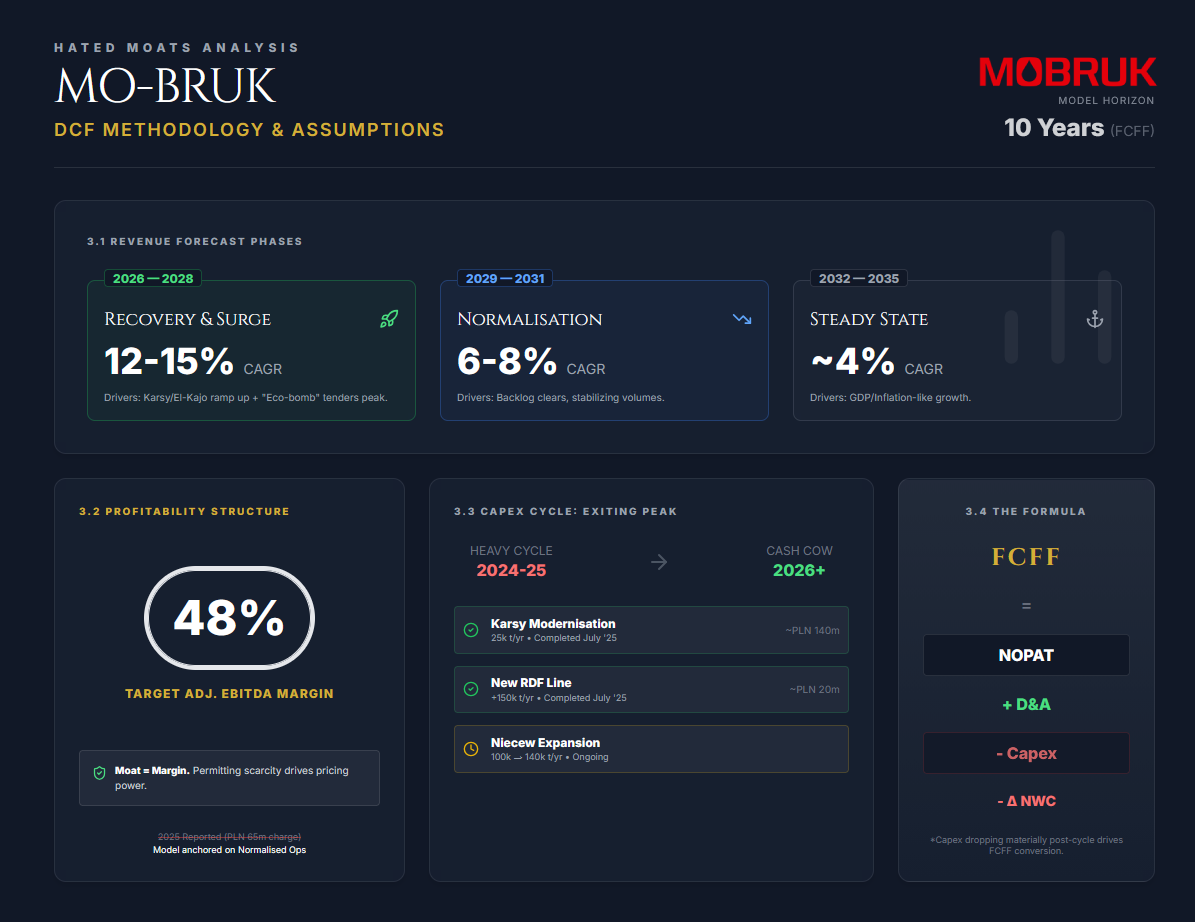
We value Mo-Bruk using a 10-year Free Cash Flow to the Firm (FCFF) model to capture the near-term clean-up super-cycle (2026–2028) as well as the long-lived cash compounding of scarce permitted assets.
3.1 Revenue Forecast (Years 1-10)
We model 3 phases:
Recovery & Surge (2026–2028): 12–15% CAGR as Karsy / El-Kajo ramp fully and “eco-bomb” tenders peak
Normalisation (2029–2031): 6–8% growth as backlog clears
Steady State (2032–2035): ~4% growth (GDP/inflation-like)
3.2 Profitability (EBITDA → NOPAT)
Mo-Bruk’s moat expresses itself in margin structure. Over time, the model assumes a sustained ~48% adjusted EBITDA margin, consistent with the business’s permitting scarcity and pricing power, with NOPAT scaling as major capex projects roll off.
Key contextual note is that reported 2025 profitability was distorted by the PLN 65.2m ($18.2m) write-down. The model is anchored on normalised operations, not the retrospective accounting charge.
3.3 Reinvestment (D&A, Capex, Working Capital)
The company is exiting a heavy capex cycle:
Karsy (newly modernised facility with a capacity increased to 25,000 tonnes/year) modernisation completed (July 2025; ~PLN 140m)
New RDF line launched (July 2025; ~PLN 20.1m; +150k t/yr capacity)
Niecew modernisation ongoing (100k → 140k t/yr)
Capex is assumed to drop materially post-cycle, supporting a step-up in FCFF conversion.
3.4 Free Cash Flow to the Firm (FCFF)
Assumed FCFF is calculated as follows:
FCFF = NOPAT + D&A − Capex − ΔNWC
3.5 Discount Rate (WACC)
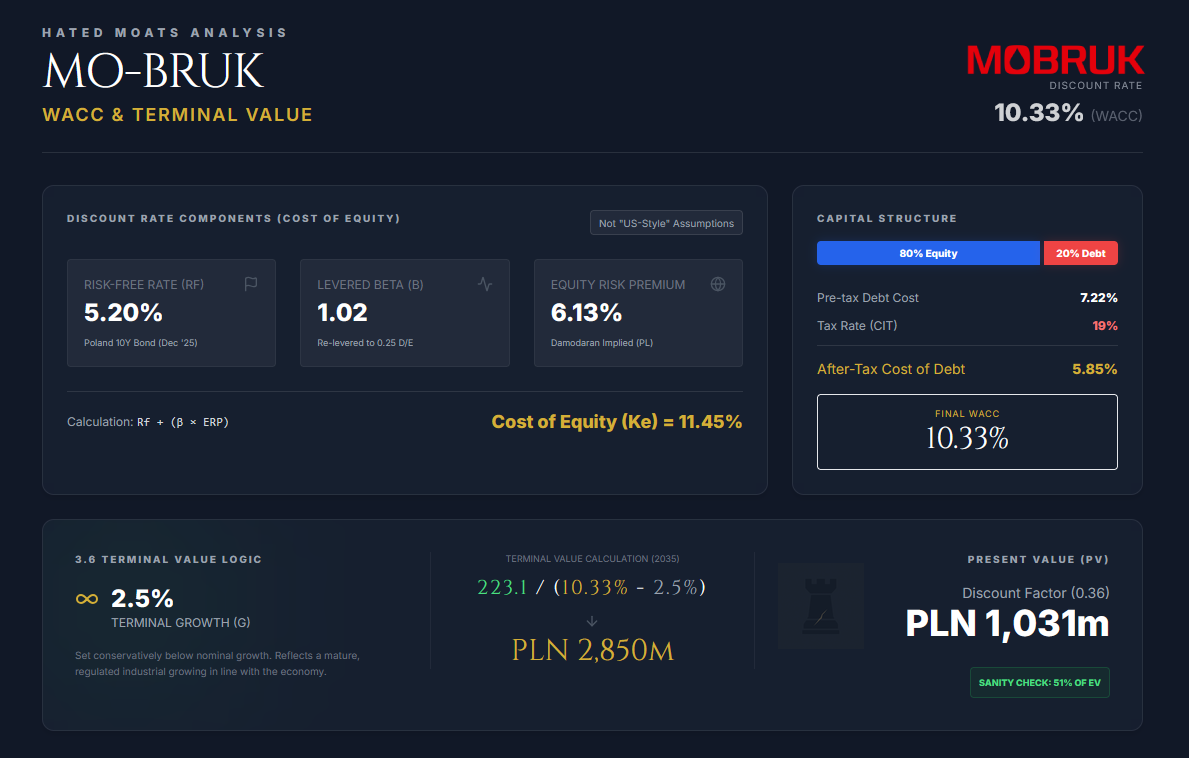
We use the Weighted Average Cost of Capital (WACC) as the hurdle rate to discount Mo-Bruk’s future free cash flows to today. For a Poland-listed, regulation-heavy industrial, the discount rate is driven primarily by local risk-free rates and country risk. Thus, note that this is not “US-style” assumptions.
Risk-Free Rate (Rf): 5.20% (Yield on the Poland 10-Year Government Bond (Dec 2025).
Equity Risk Premium (ERP): 6.13% (Damodaran’s adjusted implied ERP for Poland (mid-2025 proxy))
Levered Beta (β): 1.02 (Based on an unlevered beta of 0.85 (European environmental services) re-levered to a target D/E of 0.25, reflecting a conservative, sustainable balance sheet.)
Cost of Equity (Ke):
Ke = Rf + β x ERP
Ke = 5.20% + 1.02 x 6.13% = 11.45%
Pre-tax Cost of Debt: 7.22% (Estimated as WIBOR (note: Warsaw Interbank Offered Rate) 3M (~4.22%) + 3.00% spread.)
Tax Rate: 19% (Poland CIT)
After-Tax Cost of Debt
Kd(1−t) = 7.22% x (1−0.19) = 5.85%
Capital Structure (weights): We assume a conservative mix: 80% equity / 20% debt.
WACC Calculation
WACC = (E/V x Ke) + (D/V x Kd x (1 − t))
WACC = (0.80 × 11.45%) + (0.20 × 5.85%) = 9.16% + 1.17%
WACC = 10.33%
3.6 Terminal Value
We calculate the Terminal Value (TV) using the Perpetuity Growth Method, assuming Mo-Bruk continues indefinitely as a going concern.
Terminal Growth Rate (g): 2.5%
Set conservatively below long-term nominal growth expectations, reflecting a mature, regulated industrial that should grow roughly in line with the economy over time.
Formula:
TV = FCFF(n+1) / (WACC − g)
3.6.1. Terminal-year cash flow (2036E)
FCFF(2036E) = FCFF(2035E) x (1 + g)
FCFF(2036E) = 217.7 x 1.025
FCFF(2036E) = 223.1m (PLN)
3.6.2. Terminal Value at end of 2035
The Gordon Growth formula applied to FCFF:
TV = FCFF2036 / (WACC - g)
TV = 223.1 / (0.1033 - 0.025)
TV = 223.1 / 0.0783
TV = ~PLN 2,850m
3.6.3. Present Value of Terminal Value (PV)
PV(TV) = TV x Discount Factor (end-2035)
≈ 2,850 × ~0.36
= ~PLN 1,031m (with rounding/timing convention)
Sanity check: PV of TV is ~51% of total Enterprise Value (1,031 / 2,016), which is typical for a long-duration asset where a meaningful portion of value sits beyond the explicit forecast period.
4. Results
We sum the Present Value (PV) of the explicit forecast period cash flows and the PV of the Terminal Value to arrive at Enterprise Value.
PV of FCFF (Years 1–10): using the 10.33% WACC discount factors
Sum PV(FCFF) = PLN 985mPV of Terminal Value:
PV(TV) = PLN 1,031mEnterprise Value (EV):
EV = 985 + 1,031 = PLN 2,016m
Equity Value Bridge
Enterprise Value: PLN 2,016m
(-) Net Debt: PLN 112.15m (Gross group debt 147.4m − Cash ~35.25m)
(-) Provisions (one-time off “Marszałek”): PLN 65.2m
(-) Other adjustments: PLN 254.3m
Total Equity Value = EV - Net Debt - Provisions - Other
Total Equity Value = 2,016 - 112.15 - 65.2 - 254.3
Total Equity Value = 2,016 - 431.65
Total Equity Value = 1,584.35m
Intrinsic Value per Share
GPW’s official factsheet shows Number of shares issued: 3,512,885, then:
Value per share = 1,584,350,000 / 3,512,885 ≈ PLN 451.01
(At a current price of PLN 330, this implies ~+36.7% upside to intrinsic value.)

Scenarios
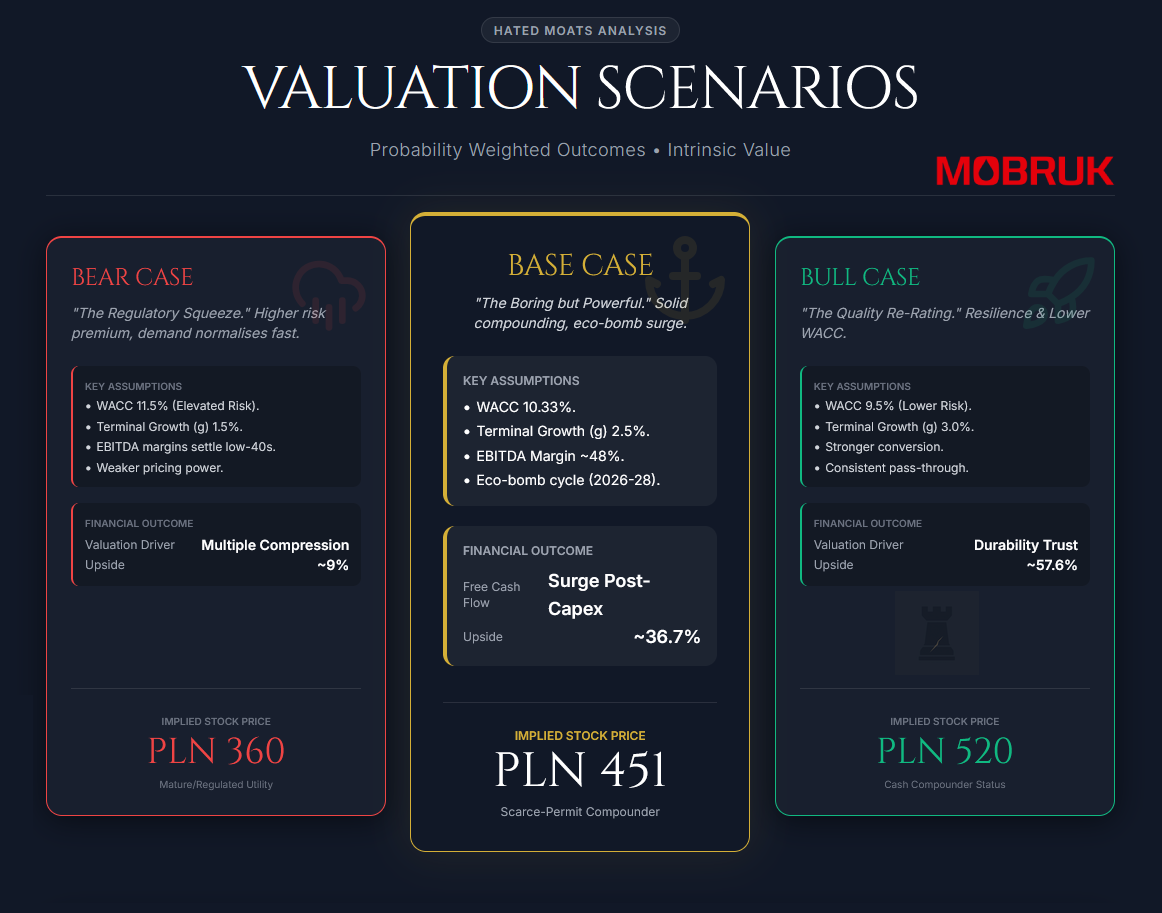
Bear Case: PLN 360/share
Inputs:
WACC: 11.5% (vs 10.33% base)
Drivers: higher Poland risk premium / rates stay elevated. ESG/political noise raises the required return for “dirty” assets.
Terminal growth (g): 1.5% (vs 2.5% base)
Drivers: Post “eco-bomb” wave demand normalises faster. Long-term growth tracks only inflation-lite.
FCFF profile: EBITDA margins settle low-40s rather than high-40s
Drivers: weaker pricing power, higher compliance costs, and slower pass-through of energy/ETS-like burdens.
Outcome:
The market treats Mo-Bruk as a mature regulated industrial with limited growth and heavier perceived risk. You still get value from the permit moat, but the multiple compresses because the discount rate rises and terminal value shrinks. Note that bear case still provides ~+9% upside.
Base Case: PLN 451/share
As modelled above (WACC 10.33%, Growth 2.5%, Margin 48% with a post-capex FCFF lift0.). The “eco-bomb” cycle (2026–2028) contributes a meaningful surge, then growth fades toward steady-state.
Outcome:
This is the “boring but powerful” case. A scarce-permit operator compounding cash flows, with the market gradually re-rating once the one-off legal overhang fades and the capex cycle converts into free cash. As mentioned above, ~+36.7% upside.
Bull Case: PLN 520/share
Inputs (optimistic but plausible):
WACC: 9.5%
Drivers for the lower WACC include rate cuts / lower Poland risk premium (with Poland actually economically moving in the right direction). The stock earns a “quality” re-rating as cash flows prove resilient.Terminal growth (g): 3.0%
Poland continues to formalise the waste market (less grey-zone leakage), and hazardous volumes keep rising structurally due to EU compliance.FCFF profile: margins hold in the high-40s, with stronger conversion, operating leverage from Karsy/El-Kajo, better mix (more high-margin hazardous incineration), and consistent pass-through on energy/regulatory costs.
Outcome:
Mo-Bruk is valued as a cash compounder with a permit monopoly rather than a “dirty cyclical.” The re-rating is driven less by hype and more by the market trusting the durability of the cash flows. This provides ~+57.6% upside.
5. Conclusion: Margin of Safety & Final Verdict
Margin of Safety = 1 – (Current Price / Intrinsic Value)
Margin of Safety = 1 – (PLN 330 / PLN 451) = 26.8%
This ~27% margin of safety places the stock in the undervalued category based on our defined scale (15% ≤ MoS < 40%).
Final verdict: Undervalued (Intrinsic Value = $451)
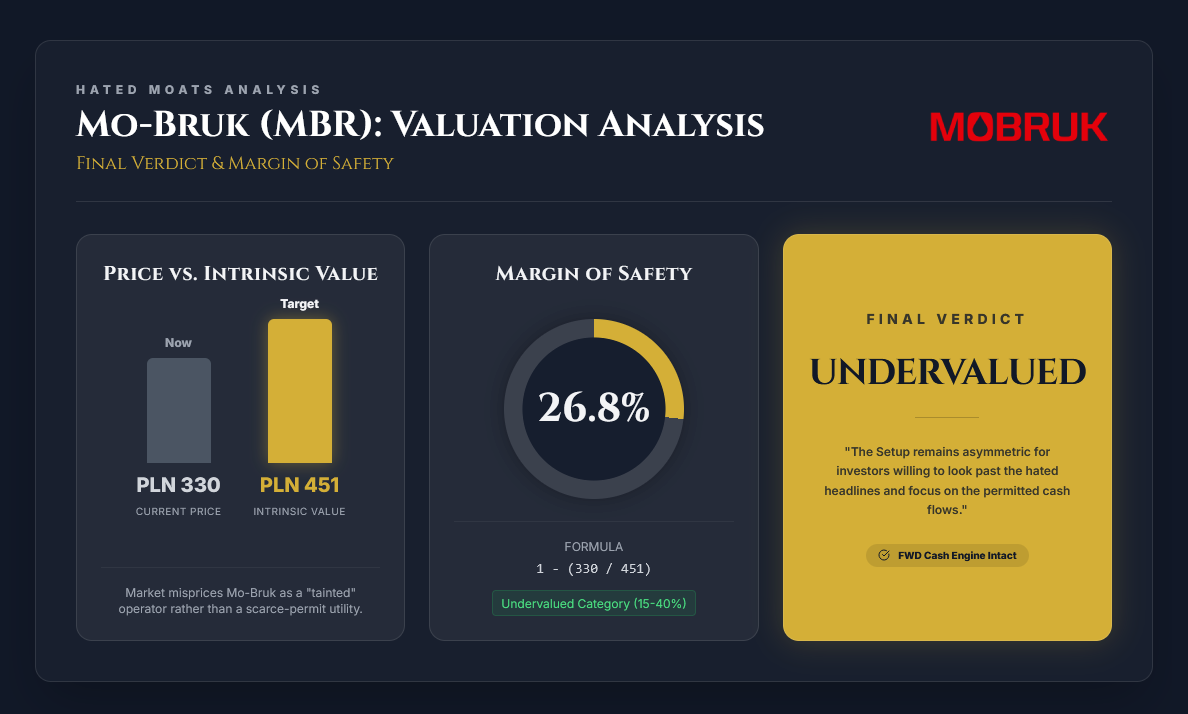
The market is currently mispricing Mo-Bruk as a legally “tainted” waste operator rather than a scarce-permit infrastructure asset that sits at the centre of Poland’s compliance upgrade cycle. The primary source of this mispricing is an optical, backward-looking accounting shock, i.e. the one-off Marszałek-related provision/write-down tied to 2018–2019 environmental fees. While headline net income turned negative (and caused panic), the business’s forward cash-generating engine remains intact. Crucially, the company is exiting a heavy capex phase, which should mechanically lift free cash flow conversion.
At the same time, Poland is being forced (by both EU policy direction and domestic political necessity) to professionalise waste handling. This means tightening tracking systems, shrinking the grey zone, and funding the clean-up of illegal hazardous dumps (“ecological bombs”). In that world, permits are the moat. Building new hazardous processing capacity is slow, politically unpopular (dirty, if you will), and practically constrained by NIMBY resistance. This means incumbents with operating permits and proven execution capacity have structurally advantaged economics.
With a ~27% margin of safety and a valuation that implies the market is still discounting Mo-Bruk as a “problem stock” rather than a cash-compounding compliance utility, the setup remains asymmetric for investors willing to look past the hated headlines and focus on the permitted cash flows.
Disclosure
The author of this report does hold a position in the security of Mo-Bruk S.A. via our Hated Moats Portfolio with avg price of PLN 313.00 per share since December 23, 2025. This report is for informational purposes only and does not constitute investment advice or a recommendation to buy or sell any security.
I'm a sucker for regulation-based moats and tons of compounders are built on these boring industrials. My qs would be what is what is the actual process of getting the permit and why are the permits so scarce?
I am curious how your discount rate for calculating the present value of terminal value is coming off 0.36. Assuming a 4% growth after 10 yrs I get (1+0.04)^11 or 1.539. For calculating present value that comes off as inv(1.539) or ~0.65. Or is my math off somewhere?