
Netflix: DCF Valuation
Is Netflix the epitome of a wonderful business at a fair price? - delayed DCFriday #007

Date of Analysis: January 11-16, 2026
Verdict: Fairly Valued
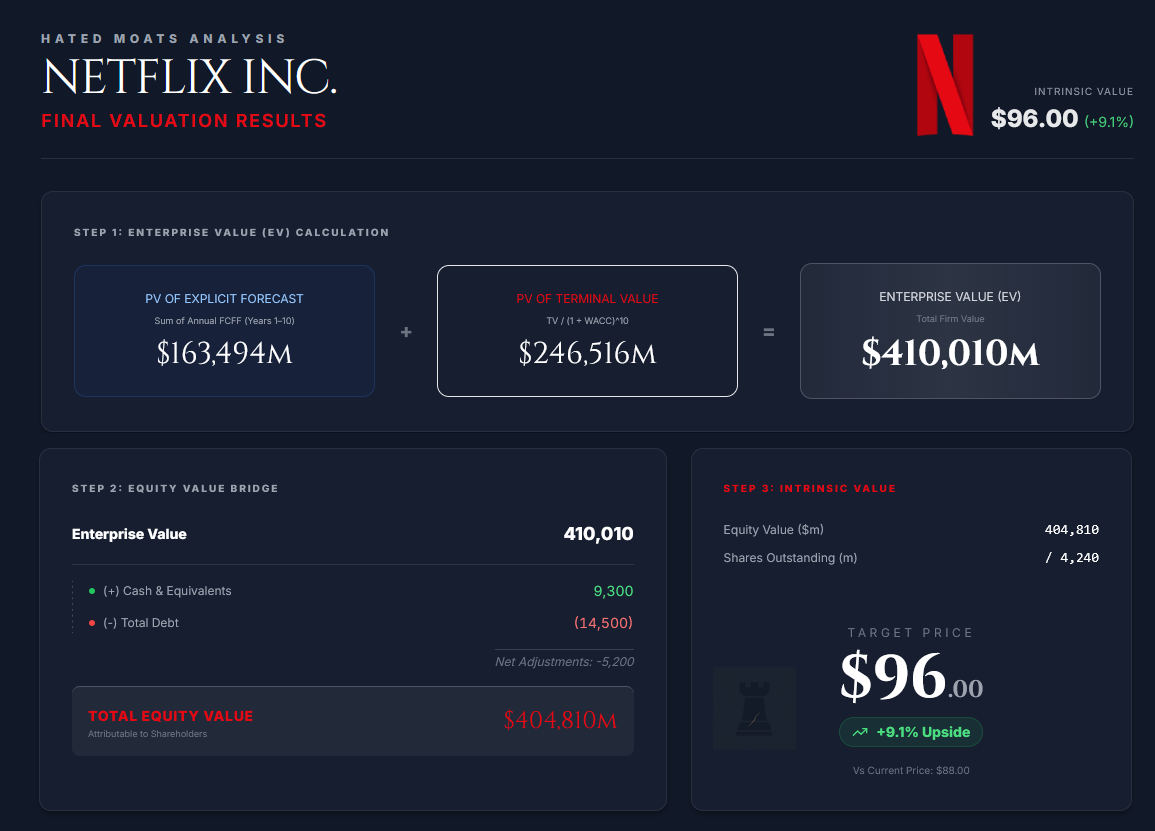
Current Price Target (Base Case): $96
Price at the Time of Analysing: $88
1. Brief Overview
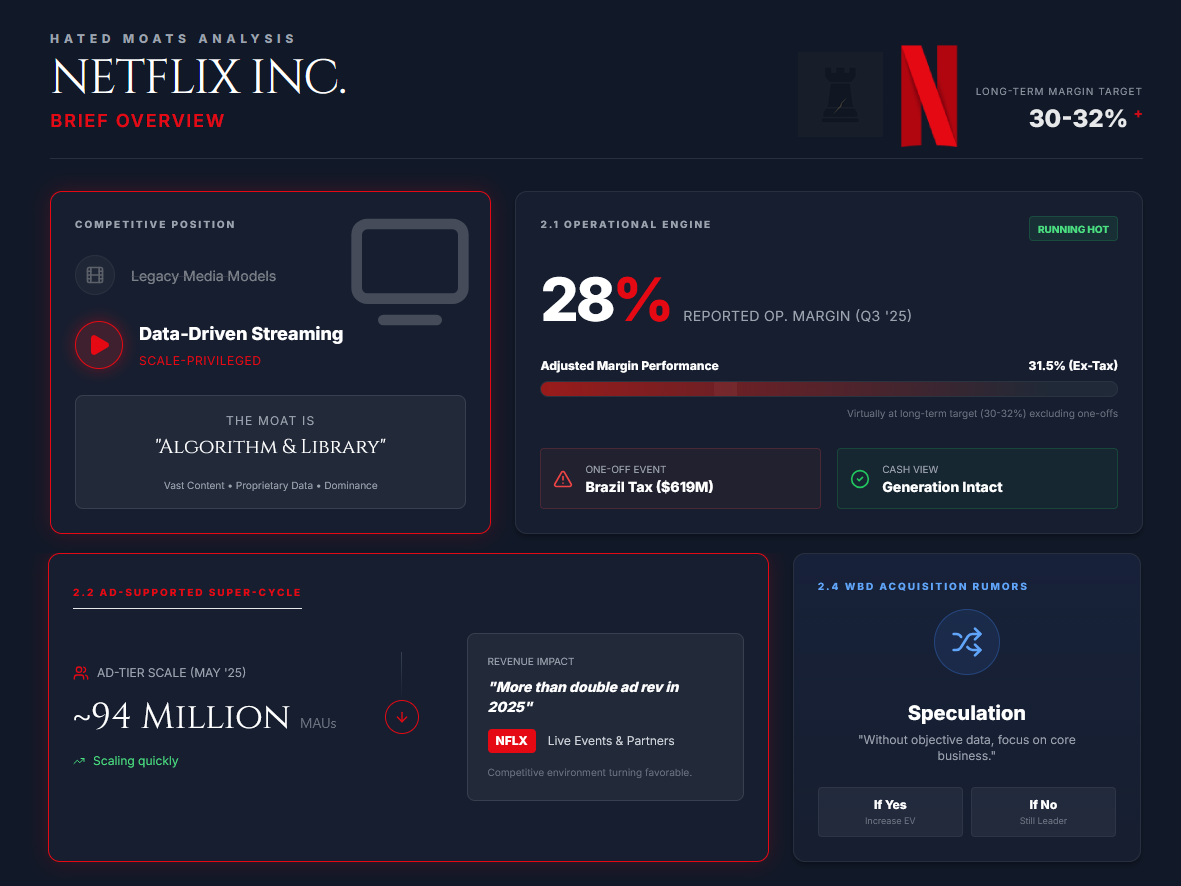
Netflix Inc. ( NFLX 0.00%↑ ) is a US-based company that can be described as a high-margin, scale-privileged streaming. Recently, Q3 2025 was optically “ugly” due to a one-off, non-recurring expense of ~$619M tied to a historical Brazil non-income tax dispute. The market frowned upon this as if it permanently impairs the business model. Our view is the opposite. The forward cash-generation capacity of Netflix’s assets remains intact, while the competitive environment is turning increasingly favourable for dominant, data-driven operators.
Operationally, the engine is still running hot, so to speak. Reported operating margin was 28% in Q3 2025, and Netflix said that absent the Brazil tax expense it would have exceeded its 31.5% margin guidance, virtually at the management’s long-term target of 30-32%, which is a truly impressive number. Meanwhile, the US and global markets are entering an ad-supported streaming super-cycle. Netflix has reported the ad-supported tier at ~94M users (monthly active users) as of May 2025 and management has said the ad business is scaling quickly (e.g., aiming to more than double ad revenue in 2025), plus additional funding via partnerships and live events. Netflix, as a dominant holder of proprietary algorithms and vast content libraries, is not going anywhere.
Then there are fears around the WBD 0.00%↑ acquisition. If it goes through, this will increase long-term enterprise value if integration is executed well. If it doesn’t go through, Netflix will most likely still be the streaming leader, though the competition (perhaps a competitor getting Warner Bros. instead) will intensify. One can bring the value up, the other down, and since it’s all speculation and talk without objective data, we will focus on core business in this analysis, not “might be”.
Let’s look at our DCF model…
2. Discounted Cash Flow (DCF): Assumptions & Methodology
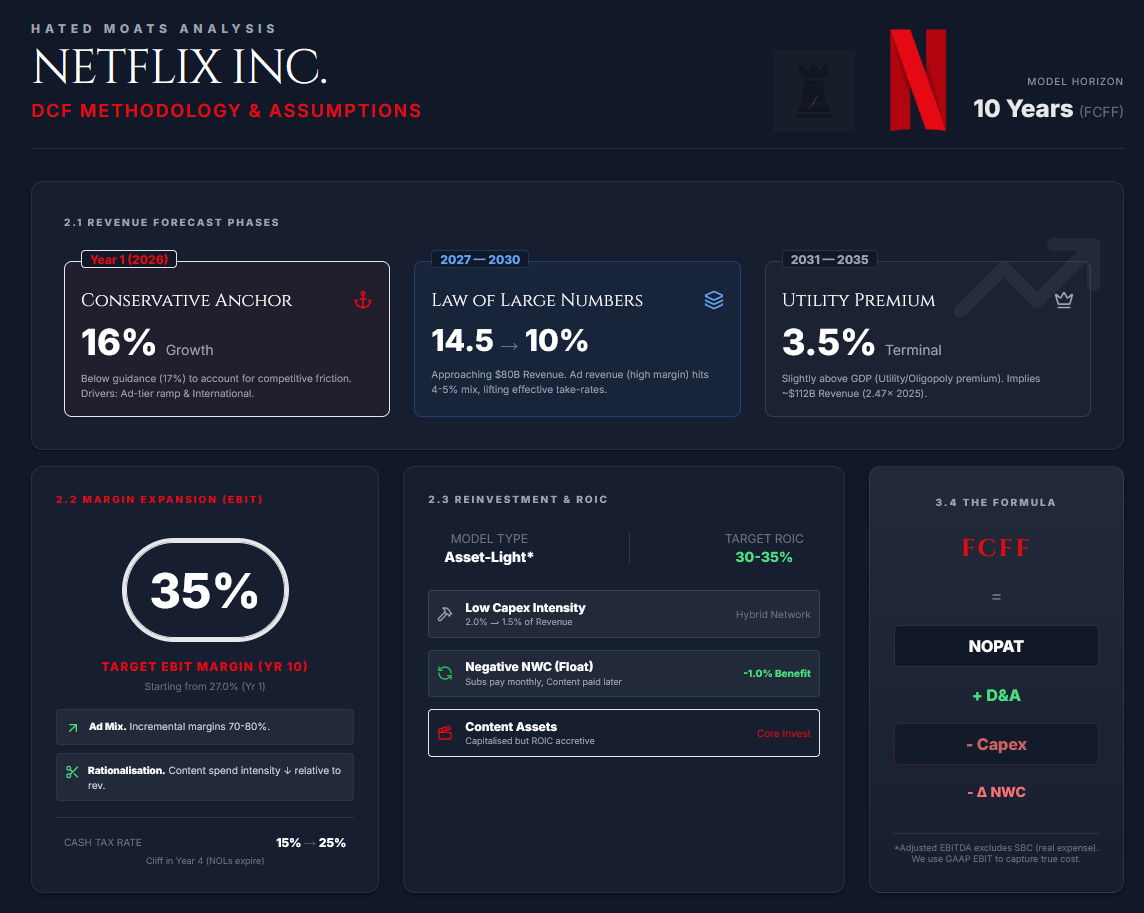
We value Netflix using a 10-year Free Cash Flow to the Firm (FCFF)
2.1 Revenue Forecast (Years 1-10)
Year 1 (2026) Growth: 16%
We anchor our 2026 forecast by referencing the company’s Q4 2025 guidance, which projects revenue growth of 17% YoY. We adopt a conservative stance, assuming 16% revenue growth in 2026, broadly consistent with the low end of that growth range after allowing for variability in subscriber additions and ad revenue ramp-up. This conservatism accounts for potential friction from increased competition in the streaming space, which may temporarily elevate churn in premium tiers. We assume continued expansion in the ad-supported tier, international subscriber growth, and the compounding effect of the advertising business, where we assumes it reaches a multi-billion annual run-rate over time.
Years 2-5 (2027-2030): Decelerating from 14.5% to 10.0%
In this phase, we assume a gradual deceleration as the law of large numbers takes effect. By 2030, Netflix would be approaching $80 billion in annual revenue under the stated growth path. Growth in this period is supported by the maturation of international markets (LatAm, APAC) and the deepening penetration of the advertising platform, which allows Netflix to increase its effective take rate without raising subscription prices. We assume that in this period, advertising is a high-margin revenue stream that structurally lifts the take rate. We assume advertising revenue grows to represent about 4-5% of revenue by Year 5.
Years 6-10 (2031-2035): Fading to 3.5%
In this terminal phase, the growth rate fades linearly to 3.5% in the terminal year (2035). This rate is slightly above long-term nominal GDP forecasts (typically 2-3%), reflecting Netflix’s pricing power as a utility and continued population growth in urban centers, and generally enjoying the premium of being on the top of an oligopoly. It assumes the streaming market has reached saturation in developed nations. Our implied 10-Year Revenue CAGR is 9.5%, which implies End-Year Revenue (2035) of roughly 2.47x 2025 revenue (i.e. $100–$112B).
2.2 Profitability (EBITDA → NOPAT)
The transition from Adjusted EBITDA to GAAP Operating Income (EBIT) is critical in our analysis. Adjusted EBITDA excludes Stock-Based Compensation (SBC), which is a real expense diluting shareholders. Our model uses GAAP EBIT to ensure a true cost of operations is captured.
Start EBIT Margin: 27.0%
Current LTM reported Operating Margin is approximately 28%, distorted by one-off items. We model 27.0% in Year 1 (2026) as a conservative normalisation level.
We assume ‘Cost of Revenue’ (primarily content amortisation) scales linearly with volume, while marketing and G&A decline as a percentage of revenue.
Long-Run Margin Path: Expands to 35.0% by Year 10
The expansion to 35% EBIT margin is driven by 3 factors.
Advertising mix shift where advertising revenue carries incremental margins in the 70–80% range.
Rationalised incentives - as the market leader cements, content spend intensity decreases relative to revenue.
Operating Leverage - the platform nature allows revenue to scale faster than headcount.
Mature digital marketplaces (e.g., Booking.com, Expedia) often achieve margins of 25-30%. We cap Netflix at 35% to account for the structurally higher costs of content production and the competitive nature of the entertainment network. While this exceeds traditional digital marketplaces, we believe Netflix’s global scale, data-driven content spend, and advertising contribution justify a modest premium to typical platform margins.
Tax Rate: 25.0%
Netflix currently benefits from tax timing effects and deferred tax assets, resulting in a low cash tax rate, resulting in a negative or near-zero cash tax rate. We assume Netflix pays a minimal cash tax rate (15%) for Years 1-3 as it utilises remaining NOLs. By Year 4 (2029), we force the tax rate to the statutory normalised rate of 25.0% (blended US federal/state and international). This creates a “tax cliff” in the FCF forecast that provides a realistic drag on value while still remaining comfortably conservative.
NOPAT Calculation
NOPAT = EBIT × (1 - Tax Rate)
2.3 Reinvestment & ROIC
Netflix operates a relatively asset-light physical model, with the majority of invested capital tied to capitalised content assets rather than owned production infrastructure. However, “asset-light” does not really mean “zero investment.”
Capex
We model Capex at 2.0% of revenue initially, converging to 1.5% in the terminal year. This spend is primarily for office facilities, production-related equipment, and internal IT / platform tooling, while core compute and distribution remain largely cloud-based. Even in a future with AI-generated content, we assume Netflix maintains a “hybrid network” approach where it partners with studios and talent rather than owning large-scale production infrastructure on its balance sheet. This preserves the ROIC profile.
Net Working Capital (NWC)
Netflix collects cash from subscribers monthly but pays content providers on a delayed cycle. This creates a negative working capital cycle where growth generates cash. We model a modest negative working capital benefit, approximated as -1.0% of incremental revenue, fading to 0% in perpetuity. This “float” is a distinct advantage of the marketplace model, acting as an interest-free loan from the subscriber base to fund growth.
ROIC (Return on Invested Capital)
We conservatively anchor current ROIC at 15%, acknowledging that reported ROIC varies materially depending on the treatment of content assets and capitalised costs. As far as a forecast goes, we model incremental ROIC on reinvested capital to remain high (>30%) due to the platform nature of the business. This pulls the aggregate ROIC up to 30-35% by Year 10.
2.4 Free Cash Flow to the Firm (FCFF)
The formula used is:
FCFF = NOPAT + D&A - Capex - ΔNWC
2.5 Discount Rate (WACC)
The Weighted Average Cost of Capital (WACC) serves as the hurdle rate for our cash flows. We construct this using market-based inputs current as of January 16, 2026.
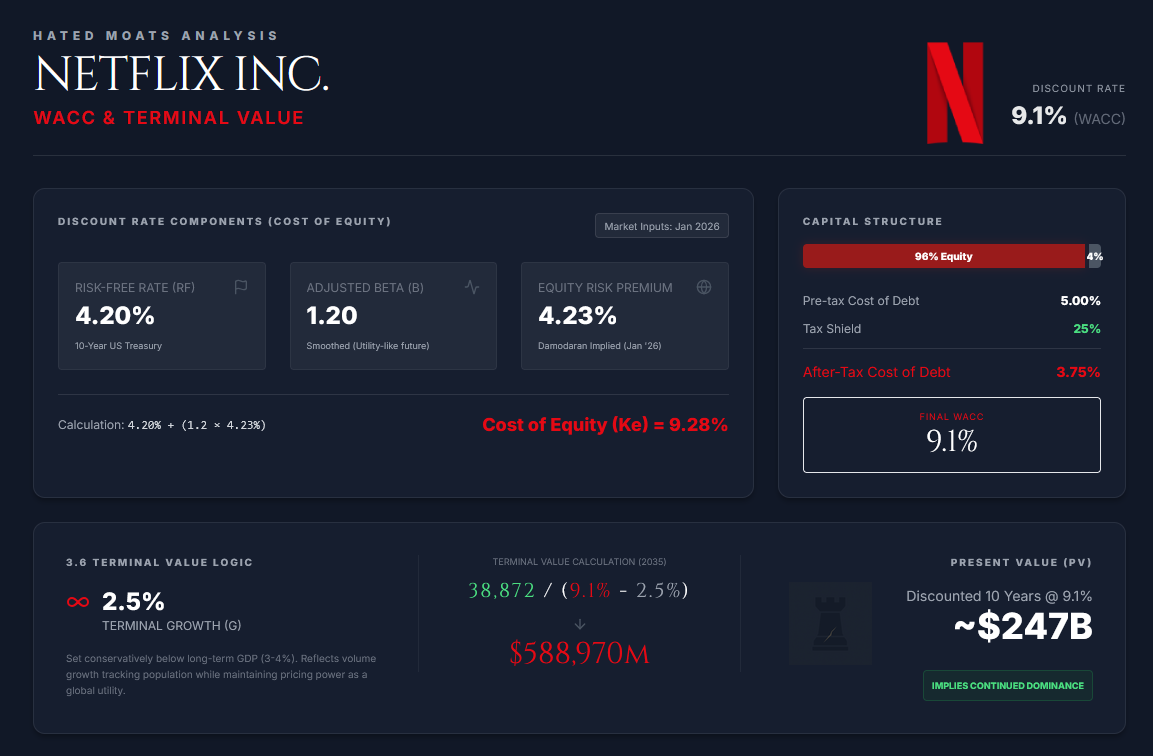
Risk-Free Rate (Rf): 4.20% (we utilise the 10-Year U.S. Treasury yield as the risk-free anchor)
Equity Risk Premium (ERP): 4.23% (Damodaran’s implied ERP estimate for January 2026)
Beta (β): 1.2 (5-Year Beta is 1.71, this captures the volatility of the “streaming correction” in 2022 so for the future analysis, we “smooth” this by the 2-Year Beta of 1.17. This reflects the recent stability and “utility-like” performance of the stock and we assume the beta to decrease in the coming years, hence 1.2)
Cost of Equity (Ke):
Ke = Rf + β x ERP
Ke = 4.20% + 1.20 x 4.23%
Ke = 9.28%
Pre-Tax Cost of Debt (Kd): 5.00% (rounded), consistent with prevailing yields on Netflix’s long-dated senior notes (roughly ~5% area), inclusive of issuance friction.
Tax Shield: 25%
After-Tax Cost of Debt:
Kd (1 - t) = 5.00% x (1 - 0.25) = 3.75%
Capital Structure: We assume ~$373 Billion market cap (at share price of $88.00), total debt at ~$14.0 Billion (long-term) + lease liabilities, which gets us to weights: ~96% Equity / ~4% Debt.
WACC Calculation
WACC = (E/V x Ke) + (D/V x Kd x (1 − t))
WACC = (0.96 × 9.28%) + (0.04 × 3.75%) = 8.91% + 0.15% = 9.06%; we round to:
WACC = 9.1%
2.6 Terminal Value
We calculate the Terminal Value (TV) using the Perpetuity Growth Method, assuming the business continues indefinitely as a going concern.
Terminal Growth Rate (g): 2.5%
This is set conservatively below the long-term nominal GDP growth expectation of 3-4%. It reflects the view that while Netflix will have pricing power, its volume growth will eventually track population and economic expansion.
Formula used:
TV = FCFF(n+1) / (WACC - g)
The calculation is as follows:
FCFF(Y11) = FCFF(Y10) x (1 + g) = 37,924 x 1.025 = 38,872
then
TV = 38,872 / (0.091 - 0.025) = 38,872 / 0.066 = $588,970 million
3. Results
We sum the Present Value (PV) of the explicit forecast period cash flows and the PV of the Terminal Value to arrive at the Enterprise Value.
PV of FCFF (Years 1–10)
Using the 9.1% WACC discount factors:
PV(TV) = TV / (1 + WACC)^10
PV(TV) = $588,970 million / (1+ 0.091)^10
then PV of Terminal Value = $246,516 million
PV(FCFF) = $163,494 Million (the sum of annual FCFF discounted at 9.1% over Years 1–10 (excluding terminal value)
Enterprise Value (EV): 163,494 + 246,516 = $410,010 million
Equity Value Bridge:
Enterprise Value: $410,010M
(+) Cash & Cash Equivalents: $9,300 (Sept 30, 2025)
(-) Total Debt: $14,500 (rounded)
Total Equity Value: $404,810 Million
Intrinsic Value per Share
Shares Outstanding: 4,240 Million (Weighted Average Q3 2025, adjusted for 10-to-1 split), then:
Value per share = 404,810 / 4,240 ≈ $95.50, rounded to $96 per share
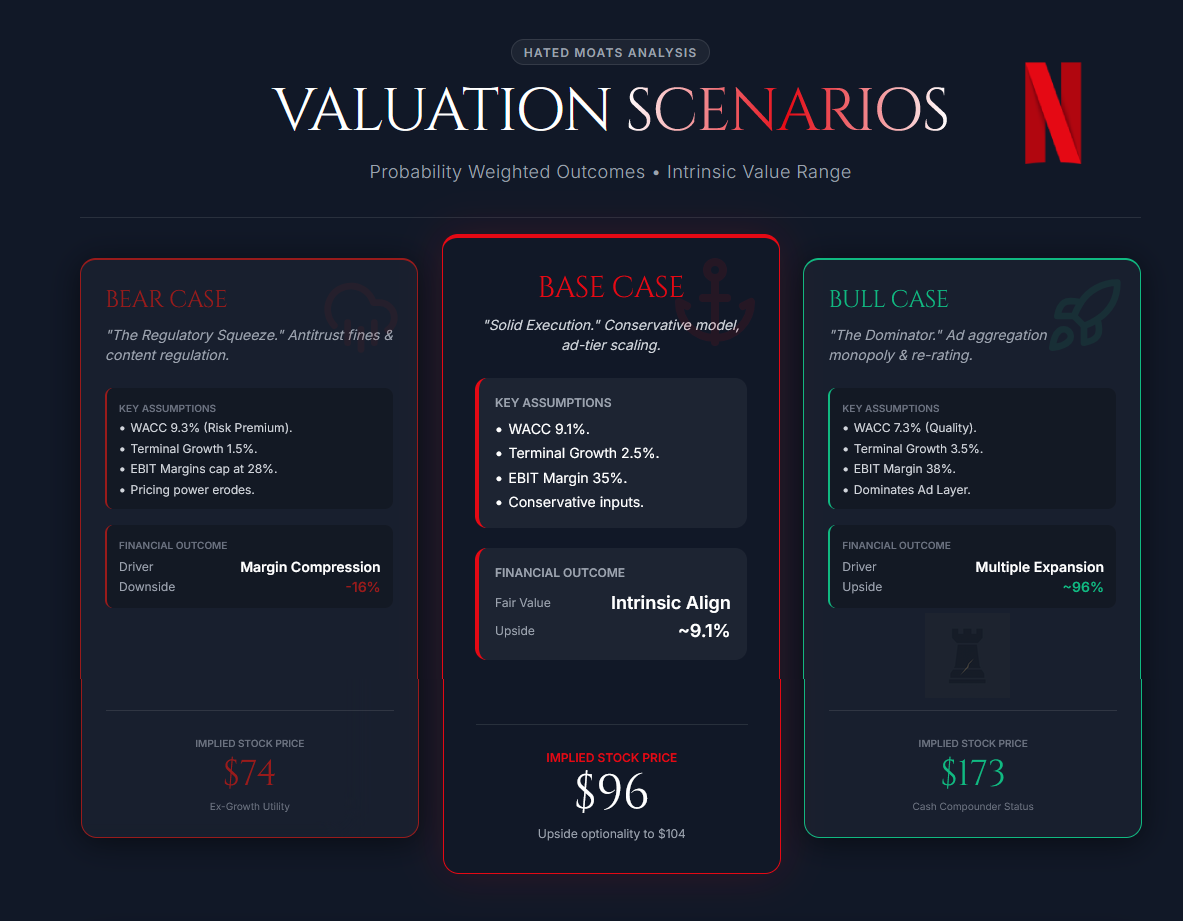
4. Scenarios
Bear Case: $74/share
Inputs:
WACC rises to 9.3% due to regulatory crackdowns (antitrust fines, content regulation). Terminal growth falls to 1.5% as competitors (Disney, Amazon) erode pricing power. EBIT margins cap at 28%.
Outcome:
Lower terminal growth, higher discount rate, and lower steady-state margins compress intrinsic value materially versus base case.
Base Case: $96/share
As modelled above (WACC 9.1%, Growth 2.5%, Margin 35%). Note that our strict base-case model output is $96/share. Since our inputs are (always) rather conservative, we’d like to also present an upside fair value of ~$103–$104/share under a slightly lower cost of capital (e.g., WACC ~8.7% from deleveraging / lower beta) and/or a modestly higher terminal growth assumption (e.g., g ~3.0% vs 2.5%), which implies a slight premium for the optionality of the ad network. We are firm on our conservative assumptions, though, and thus the base case remains at $96.
Bull Case: $173/share
Inputs:
WACC compresses to 7.3%. Netflix dominates the ad aggregation layer. Margins expand to 38% driven by Advertising and Membership dominance. Terminal growth 3.5%.
5. Conclusion: Margin of Safety & Final Verdict
Margin of Safety = 1 – (Current Price / Intrinsic Value)
Margin of Safety = 1 – ($88 / $96) = 8.33%, rounded to 8%
This ~8.0% margin of safety places the stock in the fair valued category based on our defined scale (15% ≤ MoS < 40%). Note that when using slightly more optimistic intrinsic value of $104, MoS comes to 15% and the stock can be considered (mildly) undervalued in this case.
Final verdict: Fairly Valued (Intrinsic Value = $96)
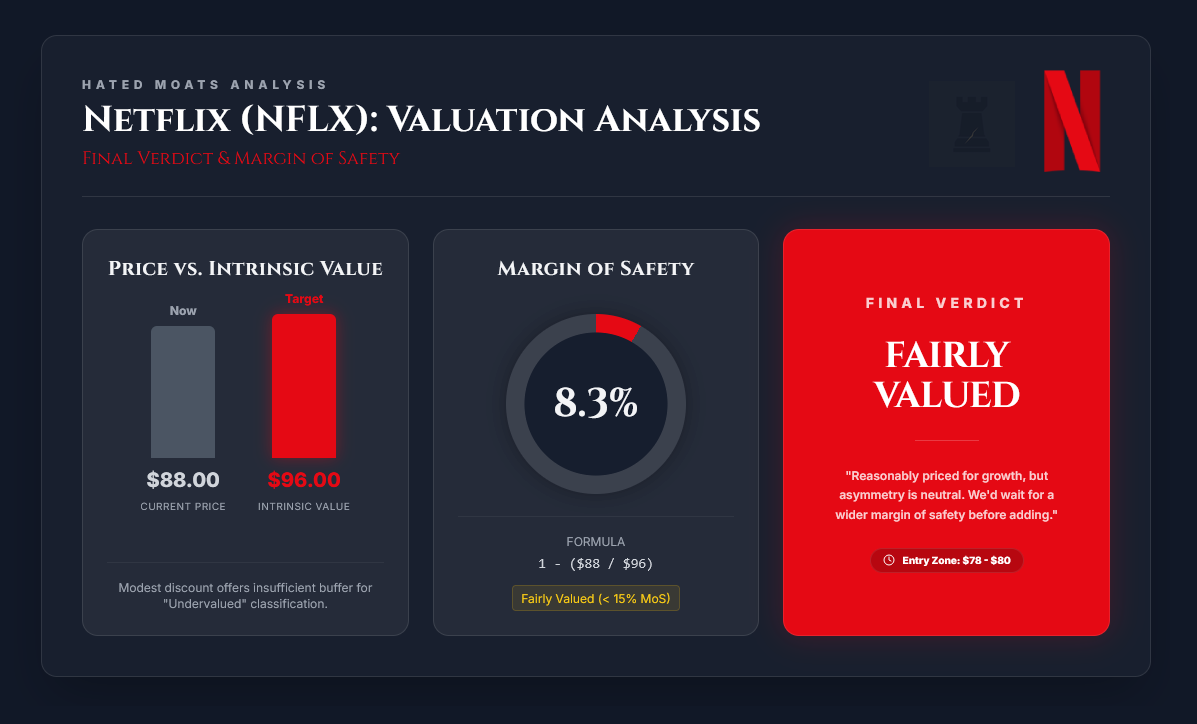
At the current market price of $88, Netflix is trading at a modest discount to our modeled intrinsic value, but the buffer is insufficient to classify it as undervalued under our strict criteria. This suggests the stock is reasonably priced for its growth trajectory and competitive position in streaming, with balanced risks from content cost inflation and ad tier adoption. Investors might consider it a hold for long-term compounding, but we’d wait for a wider MoS and clearer view of Warner Bros. acquisition before initiating or adding to positions. The core thesis on Netflix as a cash-compounding entertainment utility remains intact, but the asymmetry is now more neutral than bullish. Still, getting as good of a business as Netflix is, at fair value, is not that common. We’ll be looking for the stock to dip in the area of $78-80 per share and think about starting a position at these prices. Nevertheless, we believe that Netflix currently indeed is a wonderful business at a fair price.
Disclosure
The author of this report does not hold a position in the security of Netflix, Inc. This report is for informational purposes only and does not constitute investment advice or a recommendation to buy or sell any security.
Thanks for the analysis. The graphic design of your slides is among the most beautiful here on Substack.
thanks for the detailed breakdown.
i find some of your assumptions optimistic (e.g. just changing growth of 2.5% on terminal value to 2% could drop the MoS by 3%) - but i guess assumptions are always debatable.
in general - i thing the collapsing viewership in TV and cinema - indicates that this is not a market that will grow. I don't know what those who were born in. 2020 would watch in 2035 - but i think there's a good chance it will be generated for them rather than streamed and i'm not sure netflix's moat means much in such a world.