
Nvidia: DCF Valuation
The infamous Jim Cramer said Nvidia is now value. Is it really? - DCFriday #011

Date of Analysis: March 16-20, 2026
Verdict: Fairly Valued
Current Price Target (Base Case): $179 per share
Price at the Time of Analysing: 172.70
1. Brief Overview
There’s no brief overview this time because every single person reading this knows Nvidia and what they do. :) We’d only mention Blackwell, as it’s referred to at multiple points in our model. Blackwell is Nvidia’s latest AI-computing platform / architecture, i.e. the chips and server systems it sells to power big AI workloads in data centers. Nvidia describes it as a major step up in performance and efficiency for training and running AI models. For valuation, Blackwell matters because investors view it as Nvidia’s next big revenue engine. The company has already said recent results were helped by strong Blackwell demand, so belief in Blackwell adoption supports high expectations for future sales and profits.
So, let’s just get straight to the point of our valuation model…

2. Discounted Cash Flow (DCF): Assumptions & Methodology
2.1. Revenue Forecast (Years 1-10)
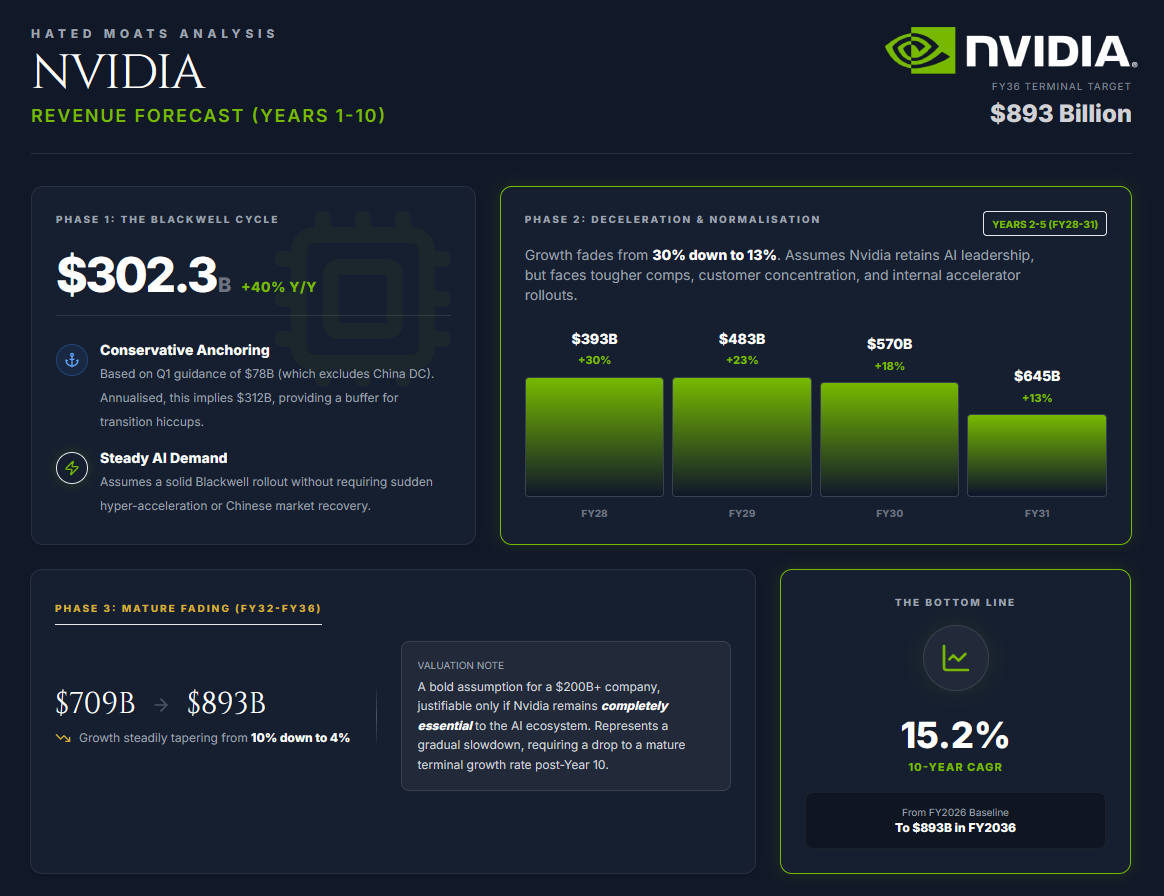
Year 1 (FY2027) Growth: 40%
We’re estimating roughly $302.3B for Nvidia’s FY2027 revenue, assuming a 40% growth rate from FY2026. This projection is anchored on their Q1 guidance of $78B (which is not assuming any Data Center revenue from China). While $302.3B sounds ambitious, it’s actually fair in our opinion. If one simply annualises that Q1 figure, you get $312 billion. This means our estimate doesn’t rely on a sudden acceleration in growth or a significant recovery in the Chinese market. It just assumes steady AI demand and a solid Blackwell rollout, while leaving some breathing room for minor hiccups during the transition.
Years 2-5 (FY2028-FY2031): Deceleration from 30% to 13%
Beyond FY2027, we model growth fading to 30.0% in FY2028, 23.0% in FY2029, 18.0% in FY2030 and 13.0% in FY2031, implying revenue of roughly $393 billion, $483 billion, $570 billion and $645 billion, respectively. This assumes Nvidia retains a leading position in AI infrastructure for longer, supported by the breadth of its hardware, networking and software ecosystem. At the same time, it recognises that the revenue base is already very large and that tougher comparisons, customer concentration and the gradual expansion of internal accelerator and custom-silicon efforts at large customers should drive a normalisation in growth over time. We believe this is a credible base case, but not particularly a conservative one.
Years 6-10 (FY2032-FY2036): Fading from 10% to 4%
For the outer years (FY2032 to FY2036), we expect growth to steadily taper off from 10% down to 4%. This puts revenue at about $709B in FY2032 and roughly $893B by FY2036, representing a 15.2% 10-year CAGR from our FY2026 baseline.
Maintaining that kind of long-term trajectory, we admit it is a bold assumption for a company already making over $200B a year. However, we also believe it’s justifiable if Nvidia stays completely essential to the AI ecosystem, but this should (as always) be viewed as a gradual slowdown rather than endless hyper-growth. Accordingly, the terminal growth rate used in the valuation beyond Year 10 will need to drop to a more mature level. More on that below…
2.2 Profitability (EBIT → NOPAT)
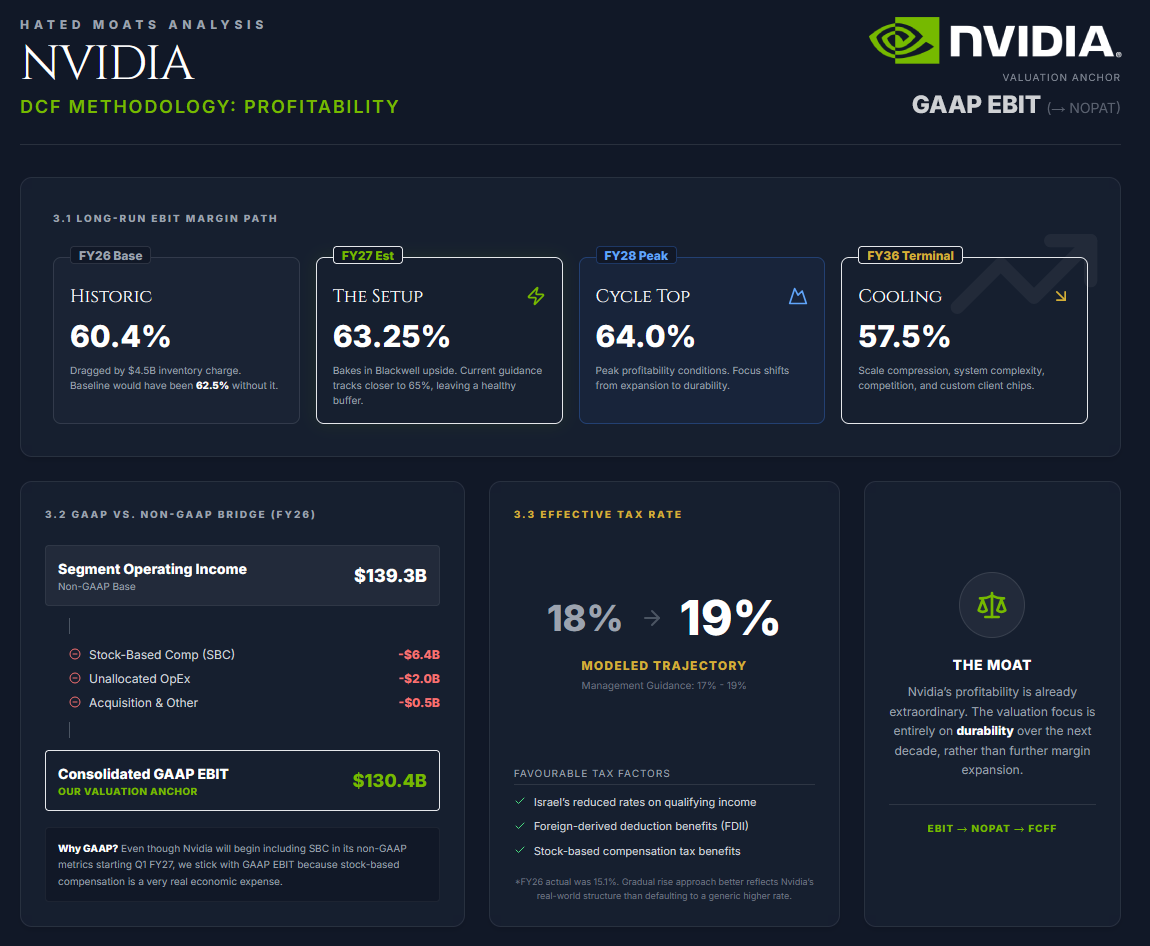
We prefer to base our profitability model on consolidated GAAP EBIT rather than Nvidia’s non-GAAP numbers. To give a general idea, in FY2026 Nvidia generated $139.3B of segment operating income, compared with $130.4B of consolidated GAAP operating income. That roughly $8.9B difference was mainly driven by $6.4B in stock-based compensation (SBC), plus about $2.0B of unallocated operating expenses and $0.5B of acquisition-related and other costs. We still anchor our valuation on consolidated GAAP EBIT, but we view segment operating income as a useful cross-check because it shows how much profitability is absorbed by enterprise-level costs that are not allocated to segments.
Starting in Q1 FY2027, Nvidia will actually begin including SBC in its non-GAAP metrics, which helps narrow this reporting gap. Even so, we’re sticking with GAAP EBIT as the cleaner baseline for our valuation work because stock-based compensation is a very real economic expense.
Start EBIT margin: 63.25%
We’re projecting a jump in GAAP operating margin from 60.4% in FY2026 to 63.25% in FY2027. While that sounds aggressive, recent numbers actually back it up. Last year’s margins were dragged down by a one-time $4.5B inventory charge. Without it, the baseline would have been around 62.5%.
Looking at the cleaner Q4 FY2026 results and management’s Q1 FY2027 guidance, operating margins are currently tracking closer to 65%. Against this backdrop, we believe our 63.25% estimate for FY2027 is quite grounded. It bakes in the financial upside from the Blackwell rollout while leaving a healthy buffer for any bumps along the way during the transition.
Long-run margin path
Nvidia’s profitability is already extraordinary, so the real focus is on durability rather than further expansion. We project EBIT margins will tick up slightly to 64% in FY2028 before gradually cooling to 57.5% by FY2036.
This is still a phenomenal long-term outlook, but we realistically assume today’s peak conditions won’t last a full decade. As Nvidia scales, margins will naturally compress due to increasing system complexity, rising competition, and major clients developing their own custom chips. Bottom line is that we expect Nvidia to maintain a massive competitive edge, even as the broader industry inevitably evolves.
Tax rate: 18.0% rising to 19.0%
Nvidia’s effective tax rate was just 15.1% in FY2026, and management expects FY2027 GAAP and non-GAAP tax rates to be between 17% and 19%, excluding any discrete items and material changes to Nvidia’s tax environment. The company also benefits from favourable tax factors such as Israel’s reduced rates on qualifying income, foreign-derived deduction benefits, and stock-based compensation tax benefits. With this in mind, we’re modeling a starting tax rate of 18% that gradually rises to 19% over time. We think this approach better reflects Nvidia’s real-world tax structure than simply defaulting to a generic higher corporate rate.
NOPAT calculation
NOPAT = EBIT x (1 - tax rate)
2.3 Reinvestment & ROIC
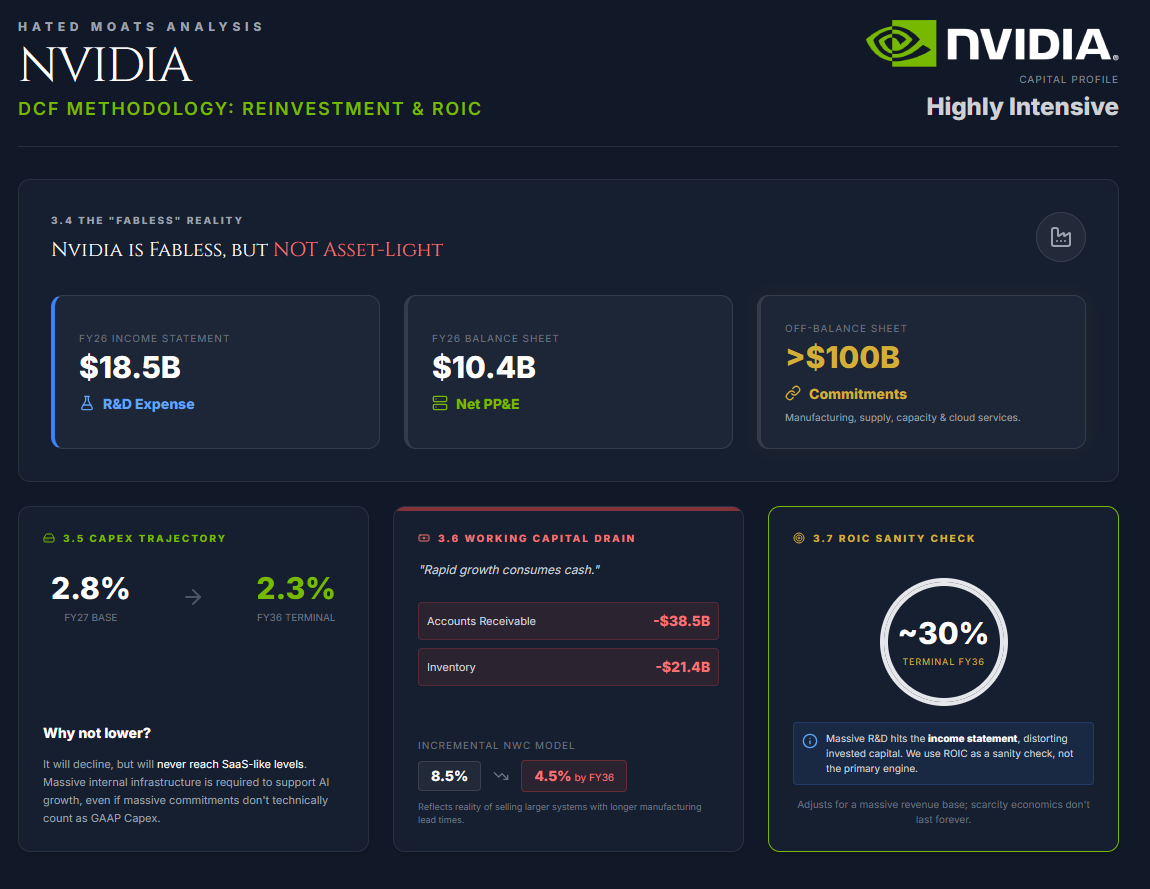
Nvidia is fabless, but it certainly isn’t asset-light. While partners handle the actual chip fabrication, Nvidia still funds a massive internal infrastructure stack. This was obvious in FY2026, when Nvidia reported $18.5B in R&D, $10.4B in net property and equipment, and well over $100B of manufacturing, supply and capacity commitments plus cloud-service commitments. The takeaway is that, even as a fabless designer, Nvidia is not asset-light in the way a software company is. It remains highly reinvestment-intensive and increasingly infrastructure-dependent.
Capex
We are modeling capital expenditures at 2.8% of revenue in FY2027 (matching FY2026 actuals) and gradually tapering to 2.3% by FY2036. While this ratio should decline over time, we do not expect it to fall to software-like levels. Nvidia’s growth still requires substantial internal infrastructure, and although cloud-service and supply-capacity commitments do not count as capex under GAAP, they still signal a business that must commit significant capital and commercial resources to support demand.
Net Working Capital (NWC)
Unlike subscription models in classic SaaS, Nvidia’s rapid growth consumes a lot of cash. In FY2026, large increases in accounts receivable ($38.5B) and inventory ($21.4B) more than offset the funding benefit from accounts payable, even though other operating liabilities also provided some offset. To reflect the reality of selling larger systems with longer manufacturing lead times, we’re modeling incremental working capital needs at 8.5% of incremental revenue initially, eventually dropping to 4.5% by FY2036 as the Blackwell rollout normalises.
ROIC (Return on Invested Capital)
Nvidia’s economic returns are phenomenal, but the exact headline ROIC depends heavily on how you define invested capital. Because massive reinvestments like their $18.5B R&D expense hit the income statement rather than the balance sheet, we use ROIC as a sanity check rather than the model’s primary engine. We expect returns on new capital to stay exceptionally high in the near term before compressing to around 30% by FY2036. This is still an incredible profile, but we believe it realistically adjusts for a much larger revenue base over time without assuming today’s scarcity economics last forever.
2.4 Free Cash Flow to the Firm (FCFF)
We calculate FCFF as:
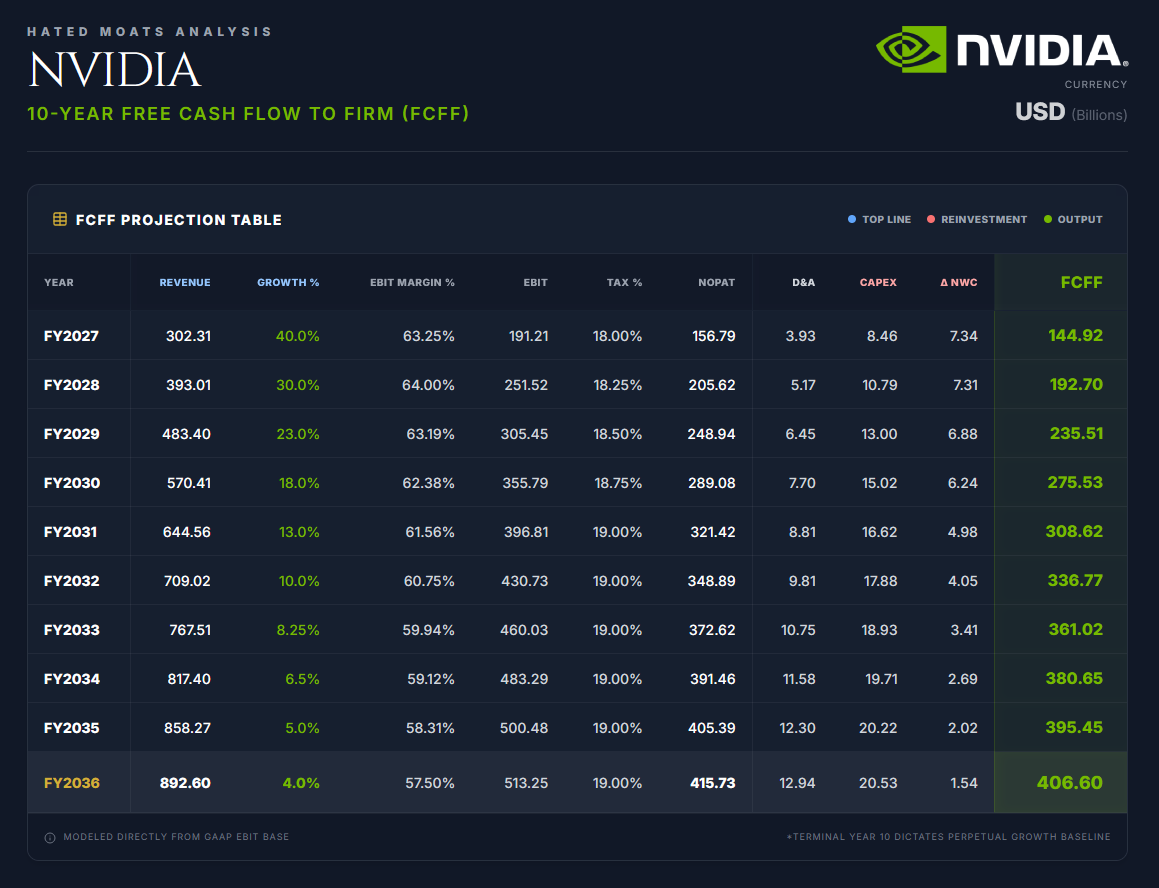
FCFF = NOPAT + D&A - Capex - ΔNWC
It’s imporant to note here, for methodology purposes, that because the model is built on GAAP EBIT, stock-based compensation remains inside operating costs and is not added back in FCFF. Adding it back would overstate cash generation unless dilution were fully offset elsewhere. We therefore add back D&A only, while handling dilution separately through the share count. Nvidia reported FY2026 depreciation and amortisation of $2.843B and stock-based compensation of $6.386B.
We model D&A at 1.30% of revenue in FY2027, rising gradually to 1.45% by FY2036. Capex starts at 2.8% of revenue and fades to 2.3%, while incremental working capital starts at 8.5% of incremental revenue and fades to 4.5%. This still underwrites an exceptionally cash-generative business, but not a frictionless one. The resulting FCFF rises from $144.9B in FY2027 to $406.6B in FY2036. Nvidia remains asset-light relative to integrated manufacturers, but its balance sheet and operating commitments still justify disciplined reinvestment assumptions.
2.5 Discount Rate (WACC)
Because Nvidia’s debt is negligible relative to the size of its equity value, the WACC is effectively a cost-of-equity judgement. As of 20 March 2026, Nvidia’s market capitalisation was roughly $4.20 trillion. Against that, debt is only about $7.5 billion at fair value, so capital structure has little practical impact on the final discount rate.
We use the following inputs:
Risk-free rate (Rf): 4.20% (based on the U.S. 10-year Treasury constant-maturity yield)
Equity risk premium (ERP): 4.23% (consistent with Damodaran’s January 2026 mature-market ERP)
Beta (β): 1.28 (We use a forward-looking bottom-up beta that reflects our view that, over the next decade, Nvidia’s risk profile should move below today’s semiconductor-cycle extremes as the business matures, customer diversification improves, and more of the company’s value comes from platform, networking, systems, and software-like economics rather than pure chip cyclicality)
Pre-tax cost of debt (Kd): 4.25%
Tax rate (t): 19.0%
The cost of equity is:
Ke = Rf + β x ERP
Ke = 4.20% + 1.28 x 4.23% = 9.61%
The after-tax cost of debt is:
Kd x (1 - t)
4.25% x (1 - 0.19) = 3.44%
Using market values, Nvidia’s capital structure is approximately:
E / V = 99.83%
D / V = 0.17%
We then calculate WACC as:
WACC = (E / V x Ke) + (D / V x Kd x (1 - t))
WACC = (99.83% x 9.61%) + (0.17% x 3.44%) = 9.60%
We therefore use a base-case WACC of 9.6%.
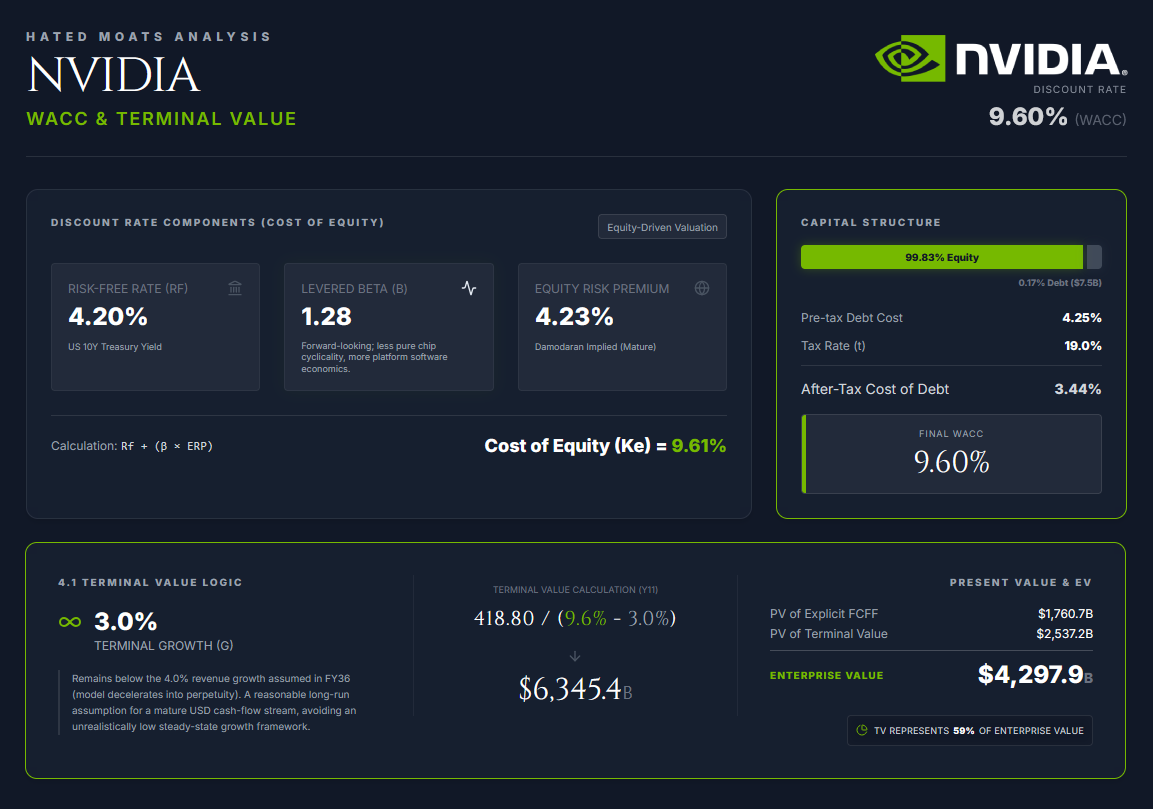
2.6 Terminal Value
We estimate terminal value using the Perpetuity Growth Method, assuming Nvidia remains a going concern beyond the explicit forecast period.
We use a 3.0% terminal growth rate. That remains below the 4.0% revenue growth assumed in FY2036, so the model still decelerates into perpetuity. At the same time, 3.0% is a reasonable long-run assumption for a mature U.S. dollar cash-flow stream and avoids forcing Nvidia into an unrealistically low steady-state growth framework.
The terminal value is calculated as:
TV = FCFF(n+1) / (WACC - g)
Using FY2036 FCFF of $406.60 billion:
FCFF(Y11) = 406.60 x 1.03 = 418.80
TV = 418.80 / (0.096 - 0.03)
TV = 418.80 / 0.066 = $6,345.4 billion
We then discount terminal value back to present value:
PV of TV = 6,345.4 / (1.096^10) = $2,537.2 billion
Adding this to the present value of the explicit forecast cash flows:
Enterprise Value = PV of explicit FCFF + PV of TV
Enterprise Value = 1,760.7 + 2,537.2 = $4,297.9 billion
Under this setup, terminal value represents about 59% of enterprise value. That is still a meaningful share, but it is not excessive for a business that exits the forecast period at more than $400 billion of FCFF. The terminal value is" “doing the work” because the explicit forecast already embeds an unusually high level of cash generation by Year 10.
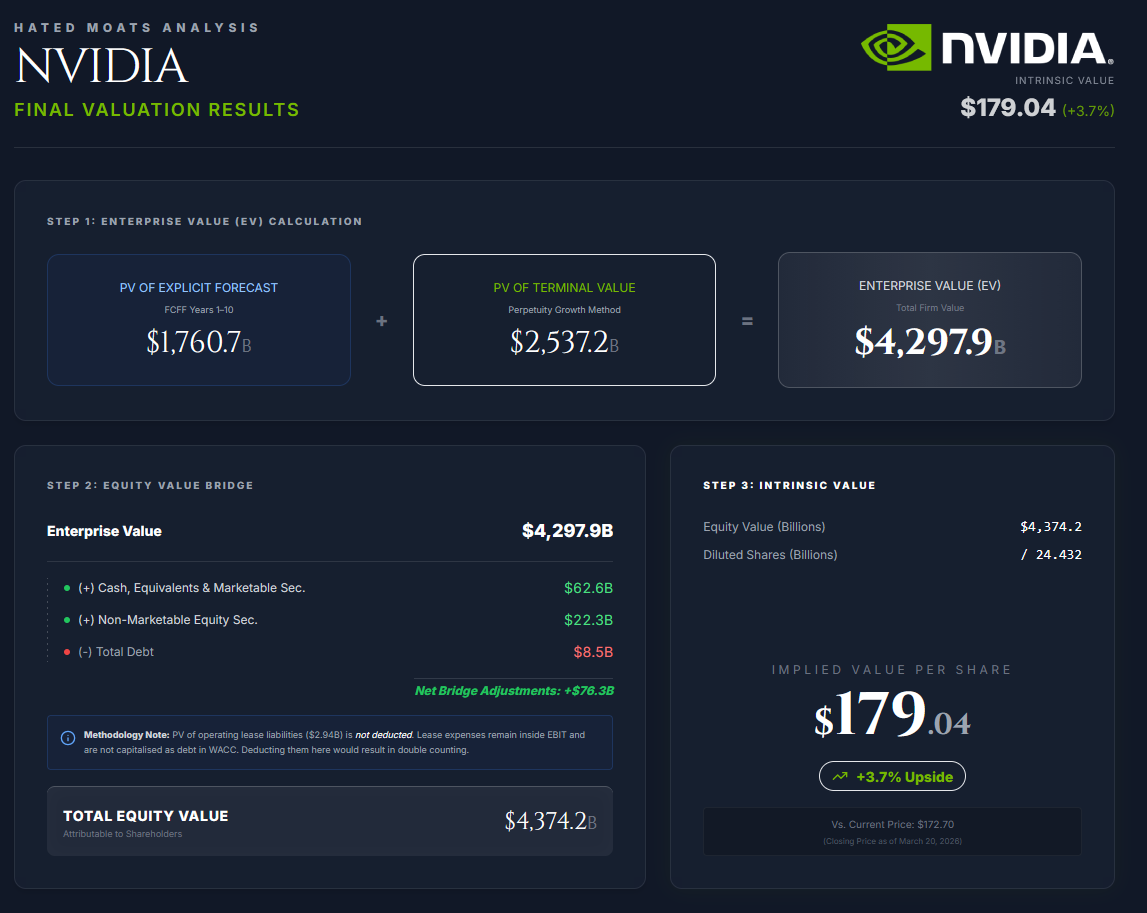
3. Results
We calculate enterprise value as the sum of the present value of the explicit forecast cash flows and the present value of terminal value:
Enterprise Value = PV of FCFF (Years 1-10) + PV of Terminal Value
Enterprise Value = 1,760.7 + 2,537.2 = $4,297.9 billion
To move from enterprise value to equity value, we add non-operating assets and subtract debt. Because lease expense remains inside EBIT and operating leases are not capitalised as debt in the WACC, operating lease liabilities are not deducted again in the equity bridge. We need to note that deducting them here would double count them which would be a methodological error. Nvidia ended FY2026 with $62.556B of cash, cash equivalents and marketable securities, $22.251B of non-marketable equity securities, and $8.468B of debt. The present value of operating lease liabilities was $2.944B, but under our DCF framework that remains embedded in operating assumptions rather than treated as a financing deduction.
The equity bridge is therefore:
Enterprise value: $4,297.9 billion
(+) Cash, cash equivalents and marketable securities: $62.6 billion
(+) Non-marketable equity securities: $22.3 billion
(-) Total debt: $8.5 billion
Total equity value: $4,374.2 billion
For per-share value, we use Nvidia’s FY2026 diluted weighted-average share count of 24.432 billion:
Intrinsic Value per Share = Equity Value / Diluted Shares
Intrinsic Value per Share = 4,374.2 / 24.432 = $179.04 per share
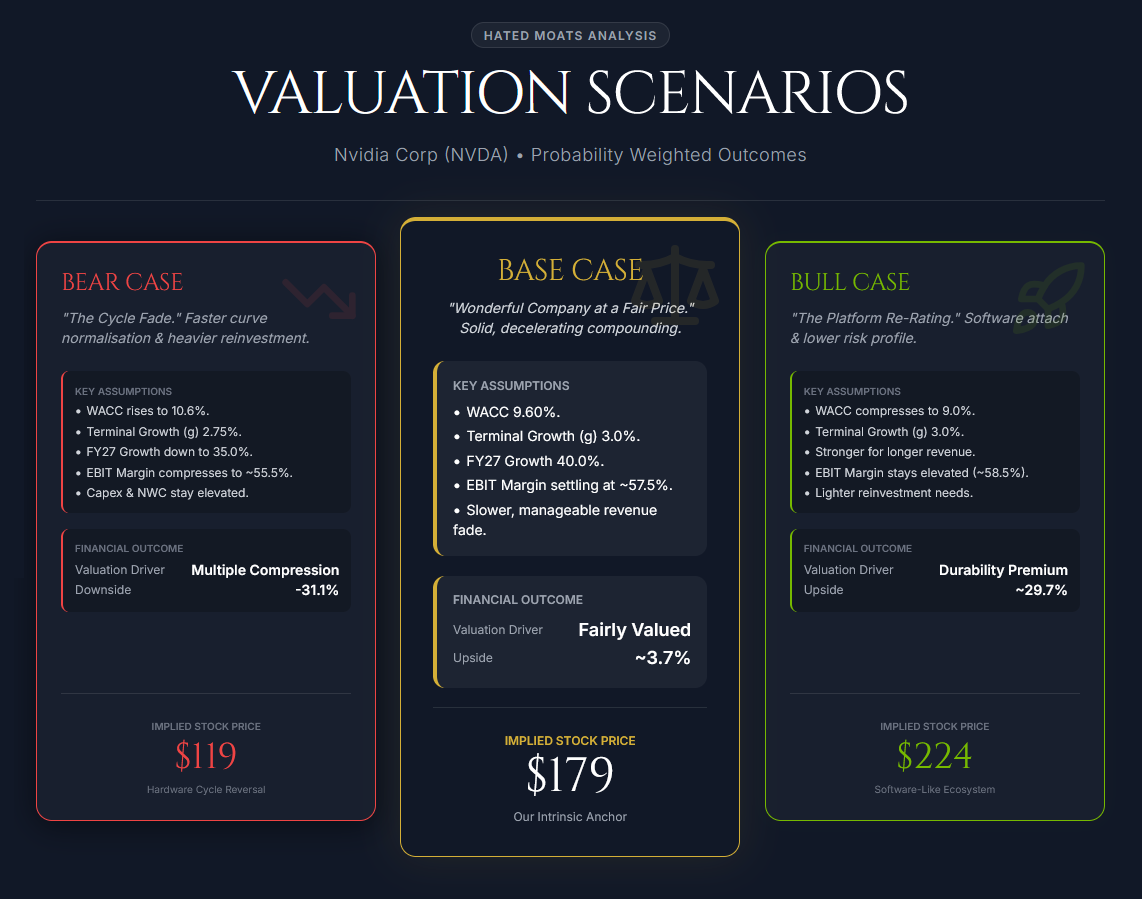
4. Scenarios
Bear case: $119 per share
Inputs:
WACC rises to 10.6%. Terminal growth falls to 2.75%. FY2027 growth comes down to 35.0%, the medium-term revenue curve fades faster than in the base case, EBIT margin peaks lower and compresses to roughly 55.5% by FY2036, and reinvestment remains somewhat heavier, with capex and working-capital needs staying above the base case.
Outcome: The bear case represents a 31.1% drop from current price.
Base case: $179 per share
Inputs: as modelled above, with WACC at 9.6%, terminal growth at 3.0%, FY2027 revenue growth at 40.0%, a slower revenue fade than in the stricter version, and EBIT margin normalising to 57.5% by FY2036.
Outcome: Around current price, Nvidia is fairly valued with a mild +3.6% upside. The company could be the epitome of “wonderful company at fair price”.
Bull case: $224 per share
Inputs: WACC compresses to 9.0%. Terminal growth remains at 3.0%. Revenue stays stronger for longer, with inference demand broadening more quickly, networking and software attach deepening further, and EBIT margin still around 58.5% by FY2036. Reinvestment also proves slightly lighter than in the base case.
Outcome: The bull case represents +29.7% upside from the current price of $172.70
5. Conclusion: Margin of Safety & Final Verdict
We calculate margin of safety as:
Margin of Safety = 1 - (Current Price / Intrinsic Value)
Margin of Safety = 1 - (172.70 / 179) = 3.5%
That is effectively very little to no margin of safety at current valuation. At the model reference price of $172.70, Nvidia is trading very close to our base-case intrinsic value of $179 per share.
Final verdict: broadly fairly valued
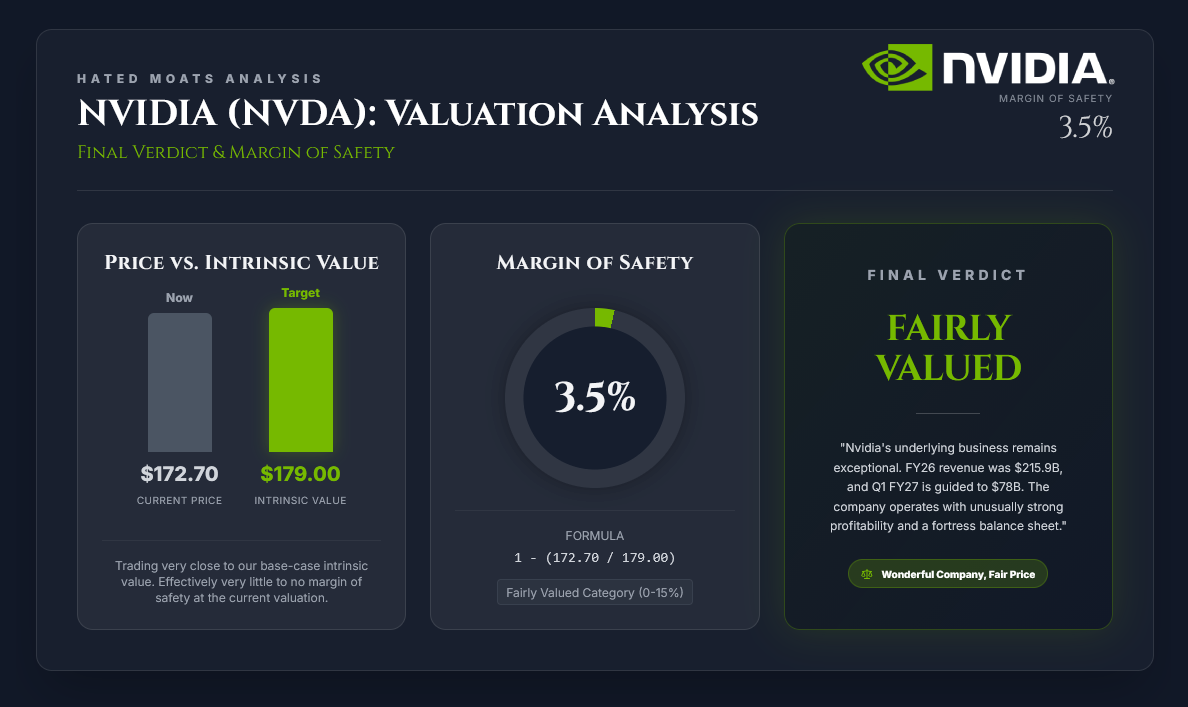
Nvidia’s underlying business remains exceptional. FY2026 revenue was $215.9B, and management guided Q1 FY2027 revenue to $78.0 billion, +-2%, while explicitly assuming no Data Center compute revenue from China in that outlook. The company also continues to operate with unusually strong profitability and a very strong balance sheet.
6. Our Strategy
Our investment strategy relies on our research, analysis and margin of safety. We acknowledge that Nvidia is a world-class wonderful company at fair price and if our analysis is correct, the company will deliver market-beating CAGR in the next 10 years. If you always wanted to own the company, now could be a good time. And if you’re bullish on the company generally, now it’s surely a good time to add. Our strategy is to wait and see at least some margin of safety - we’d like to see MoS of 15%. This means our desired entry price is around $152 per share. So, our strategy for now is to sell a cash secured put at the strike price of $150 per share, wait and see if we’ll be lucky enough to own Nvidia.
Disclosure
The author of this article does not hold a position in the security of NVDA 0.00%↑ . at the time of publishing this valuation. This article is for informational purposes only and does not constitute investment advice or a recommendation to buy or sell any security.
I started another position recently (bought and sold once in the past for substantial gains). I’m normally a value guy but I’ve progressed into growth at reasonable prices. Looking at NVDA growth and profitability metrics, their valuation actually looks relatively cheap. It’s the highest valued “value stock” I’ve probably ever owned.
I also dropped a full deep-dive analysis on #NVDA.
I’m with you — best entry sits right around $150.
Let’s see if the market hands us that opportunity.