
SAP: DCF Valuation
Is SAP one of the market’s most deeply undervalued software giants? - DCFriday #018

Date of Analysis: June 22 - 26, 2026
Verdict: Deeply Undervalued
Current Price Target (Base Case): $260
Price at the Time of Analysing: $155.09
1. Brief Overview
SAP is a global enterprise-software company best known for its enterprise resource planning systems. Its applications help organisations manage core functions including finance, procurement, human resources, manufacturing, supply chains and customer operations.
In other words, SAP makes the software that large companies use to run their day-to-day operations. It helps them track money, pay employees, order materials, manage factories, move products and serve customers, all within one connected system.
The company is shifting its installed customer base from traditional on-premise software to cloud subscriptions. SAP is increasingly embedding AI assistants and automation across its products, while remaining focused on the mission-critical processes that underpin large organisations. Yet, the SaaS apocalypse isn’t really buying it, so…
What about the current valuation? Let’s have a look!

2. Discounted Cash Flow (DCF): Assumptions & Methodology
The DCF is prepared in nominal euros, consistent with SAP’s reporting currency. The final equity value is then converted into U.S. dollars for comparison with SAP’s NYSE-listed ADR.
We use the June 22, 2026 exchange rate of $1.1456 per euro.
2.1 Revenue Forecast (Years 1-10)
Year 1 (2026): 9.1%
Our 2026 forecast combines SAP’s reported Q1 results with estimates for the remaining 9 months.
SAP generated €9.56 billion of revenue in Q1. At constant currencies:
Total revenue increased 12%
Cloud revenue increased 27%
Current cloud backlog increased 25%
However, management cautioned that quarter-specific factors would cause cloud growth to moderate in Q2. We therefore don’t annualise the exceptionally strong Q1 growth rate.
For the full year, SAP guides to:
Cloud revenue of €25.8 billion to €26.2 billion
Cloud and software revenue of €36.3 billion to €36.8 billion
Total constant-currency revenue growth broadly in line with the 11% achieved in 2025
SAP also estimated that exchange rates prevailing in March would reduce reported cloud and software revenue growth by approximately 1.5 percentage points.
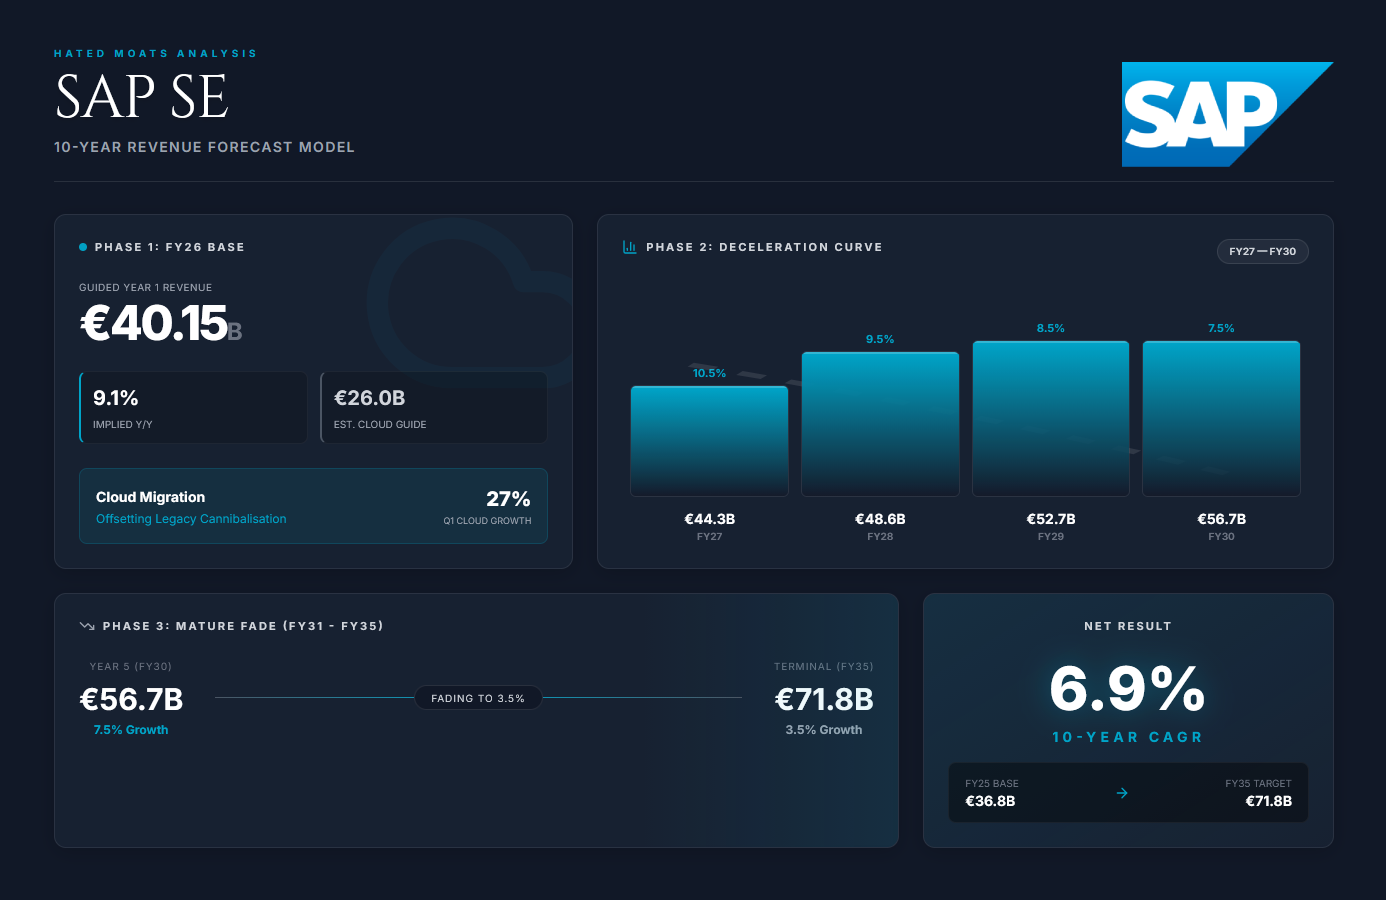
Based on this guidance, we forecast reported revenue of €40.15 billion, representing growth of 9.1%.
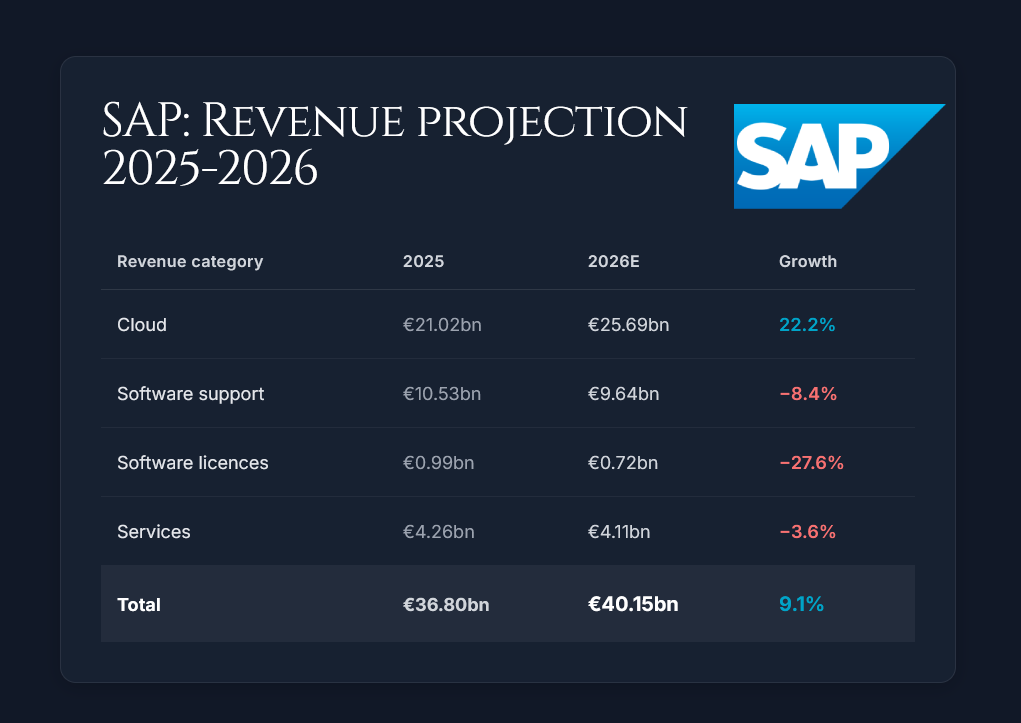
The main offset in growth is cannibalisation. As customers move to the cloud, subscription revenue replaces declining software-support and licence revenue. Strong cloud growth therefore doesn’t translate directly into the same level of consolidated revenue growth.
Years 2-5 (2027-2030): Moderation from 10.5% to 7.5%
Management expects total revenue growth to accelerate in 2027 as cloud backlog converts into recognised revenue.
We model a modest acceleration to 10.5%, followed by gradual deceleration as SAP’s cloud business becomes larger and the initial migration cycle matures.
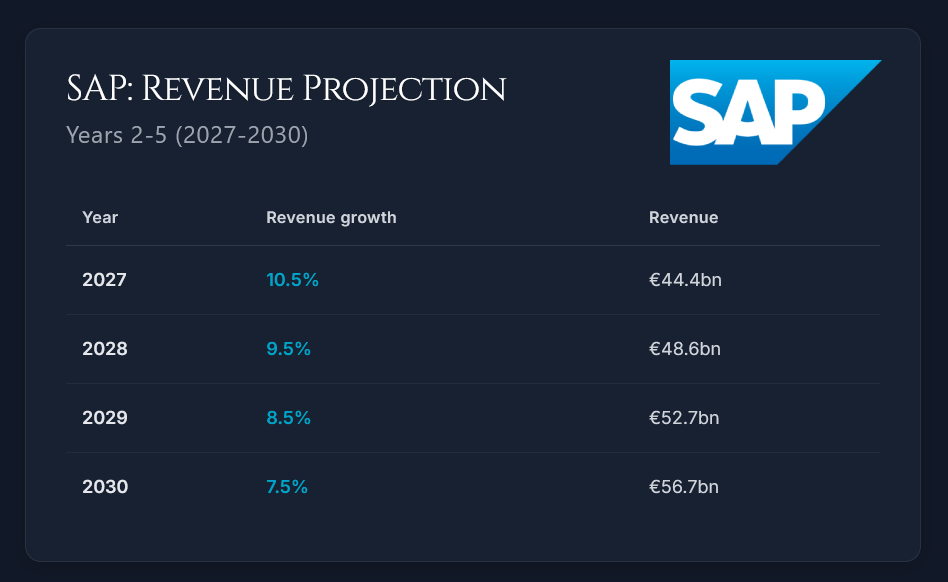
Revenue reaches approximately €56.7 billion by 2030, compared with €36.8 billion in 2025.
Years 6-10 (2031-2035): Fading to 3.5%
Beyond 2030, we assume that SAP increasingly resembles a mature, recurring-revenue software company.
Growth remains supported by pricing, customer expansion, new products and AI-related monetisation. However, the benefits from the cloud migration cycle gradually fade, while SAP’s larger revenue base makes high growth increasingly difficult to sustain.
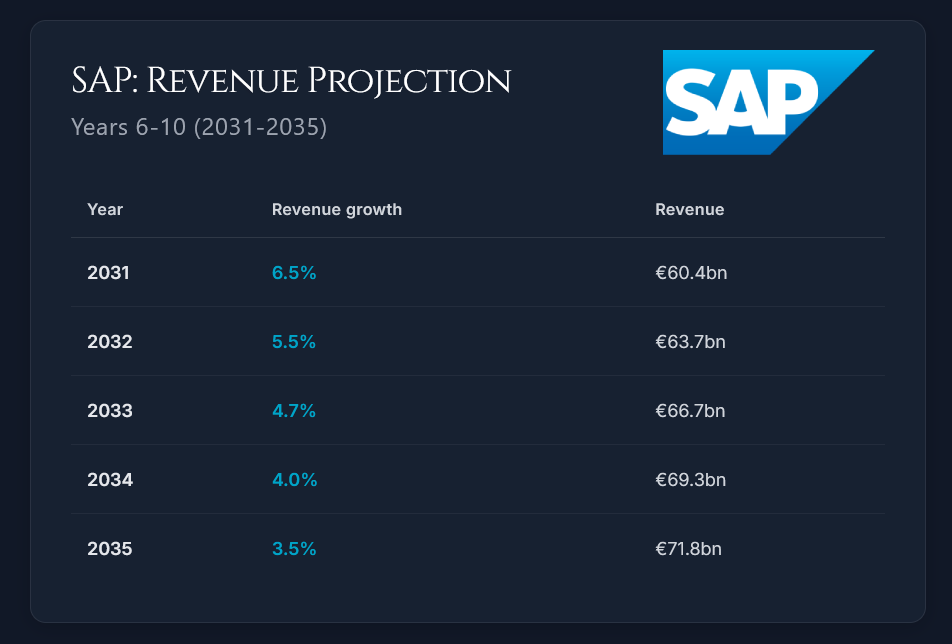
Under these assumptions, revenue reaches approximately €71.8 billion by 2035.
This represents a 2025 to 2035 revenue CAGR of approximately 6.9%.
2.2 Profitability: IFRS EBIT to NOPAT
We forecast IFRS operating profit, including share-based compensation and acquisition-related amortisation.
SBC remains an operating expense while acquisition-related amortisation is included in EBIT, but later added back through D&A because it’s non-cash.
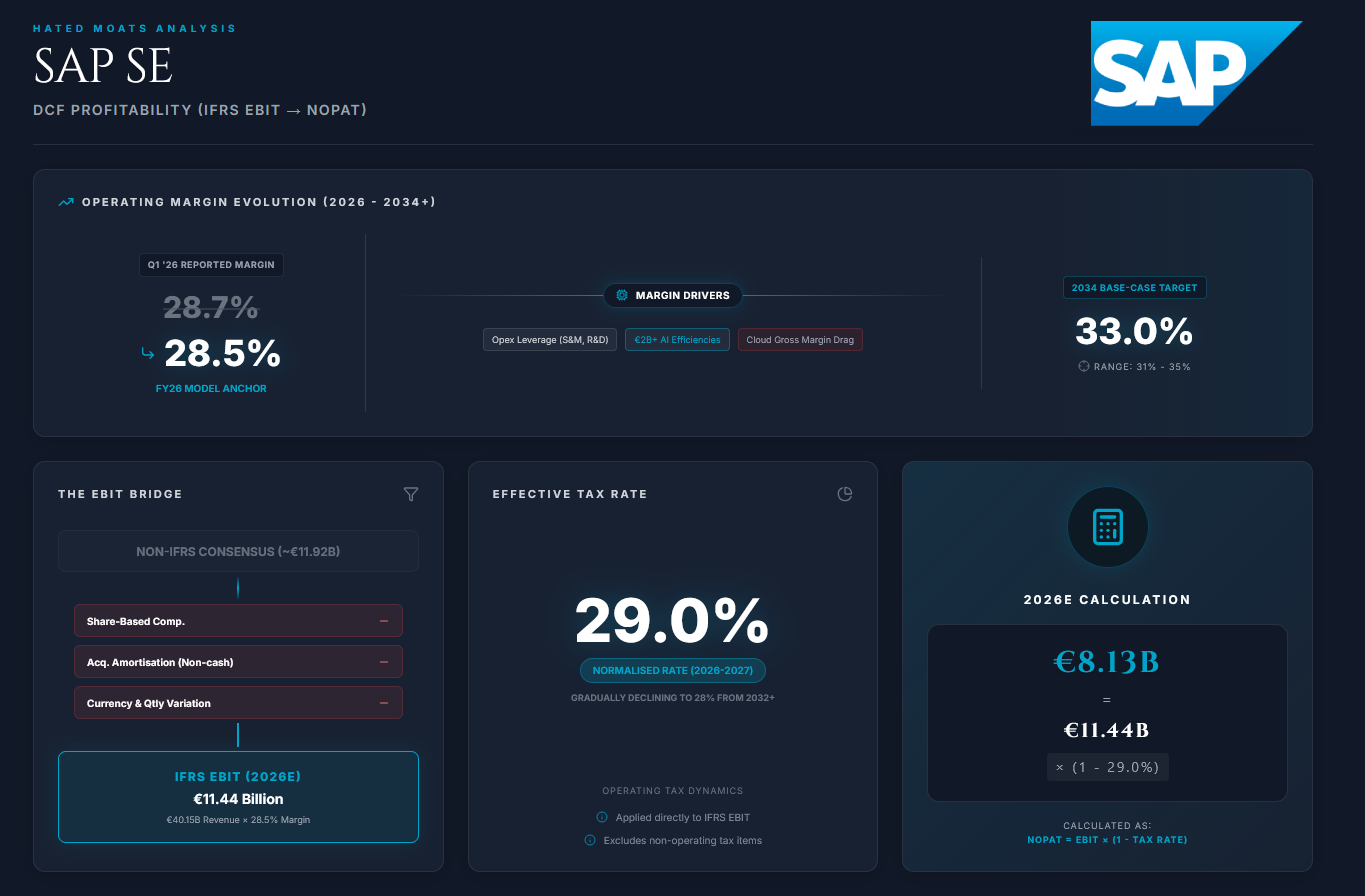
2026 Margin: 28.5%
SAP reported Q1 2026 IFRS operating profit of €2.74 billion, representing a margin of 28.7%. However, the quarter benefited from a €135 million YoY reduction in share-based compensation, so we don’t annualise the Q1 margin directly.
Consensus expects approximately €11.92 billion of non-IFRS operating profit in 2026. After deducting SAP’s expected non-IFRS adjustments, this implies an IFRS margin of roughly 28.5% to 28.8%.
We use the lower end of this range:
2026 EBIT = €40.15 billion x 28.5% = €11.44 billion
This assumption is slightly below the Q1 result and we believe such methodology is sound since it allows for currency pressure, acquisition-related expenses and normal quarterly variation.
Long-Term Margin: 33%
We expect SAP’s IFRS EBIT margin to gradually expand from 28.5% in 2026 to 33% by 2034.
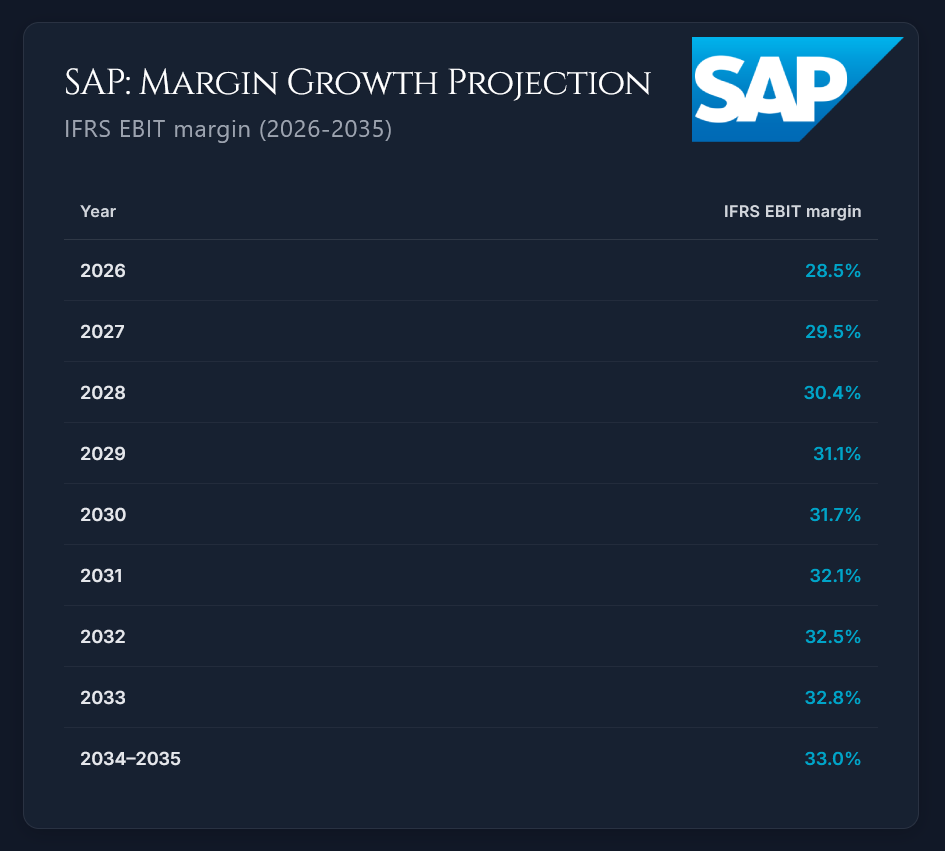
The expansion is driven by operating expenses growing more slowly than revenue, particularly across sales, marketing, R&D and administration. SAP is also targeting more than €2 billion of annualised internal AI efficiencies by the end of 2028.
However, the cloud transition is not automatically margin-accretive. SAP’s 2025 cloud gross margin was 73.9%, compared with 88.6% for software licences and support. Declining high-margin support revenue therefore offsets part of the benefit from cloud scale.
The 33% margin is our mature base-case assumption, not management guidance. It requires sustained operating leverage and should be tested against a wider range of approximately 31% to 35%.
Normalised Operating Tax Rate
We apply a normalised operating tax rate of 29% in 2026 and 2027, gradually declining to 28% from 2032 onward.
NOPAT is calculated as:
NOPAT = EBIT x (1 - tax rate)
For 2026:
NOPAT = €11.44 billion x 71% = €8.13 billion
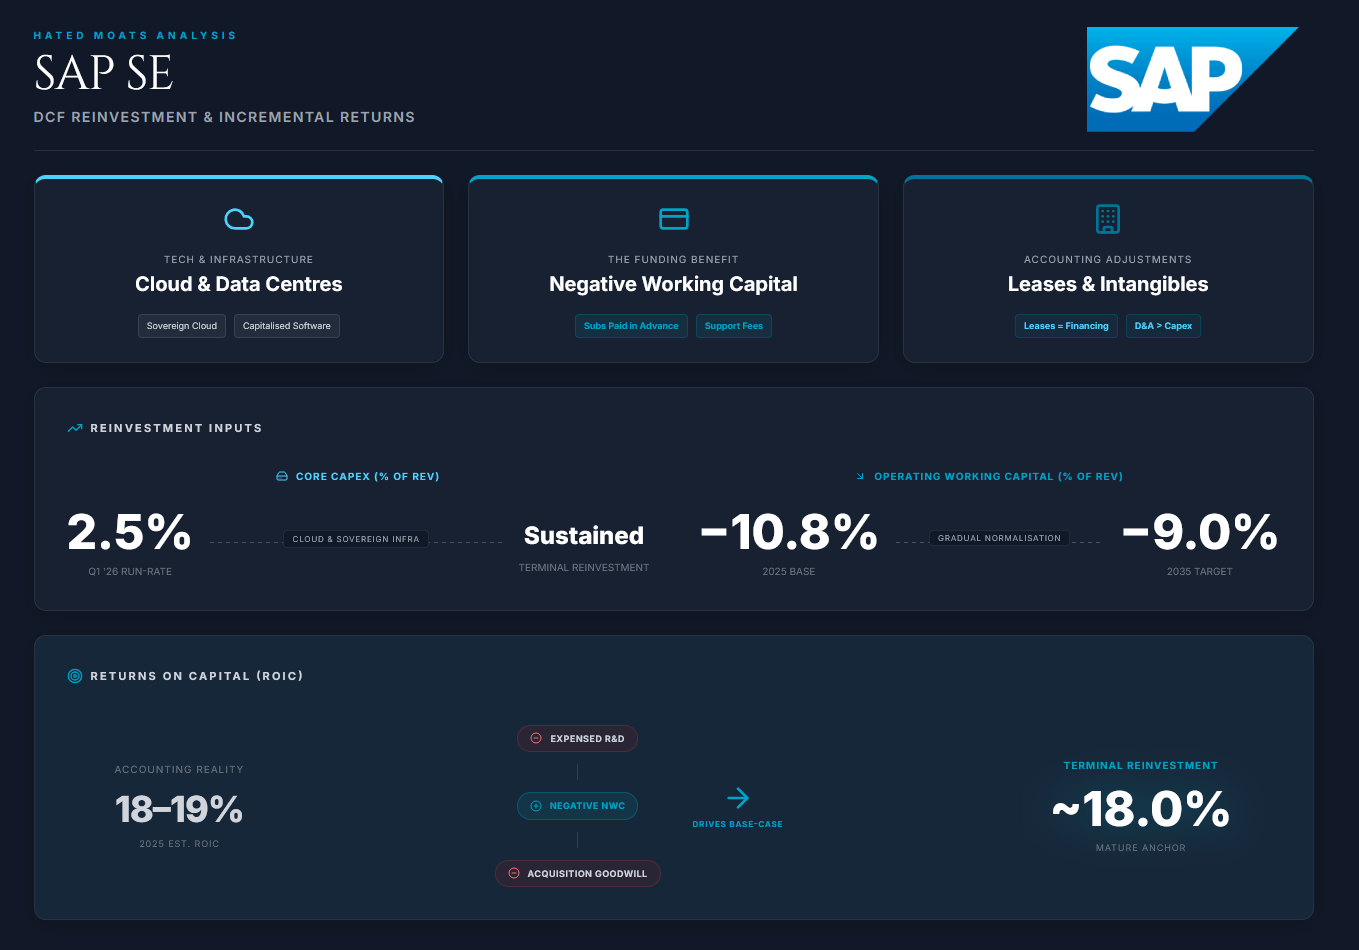
2.3 Reinvestment & ROIC
SAP is asset-light, but it still invests in cloud infrastructure, data centres, software and customer delivery. Much of its economic investment is also expensed through R&D and sales costs and is already reflected in EBIT.
SAP spent €739 million, or 2.0% of revenue, on capital expenditure in 2025. Q1 2026 capex increased to €238 million, equal to 2.5% of quarterly revenue.
Our main reinvestment assumptions are:
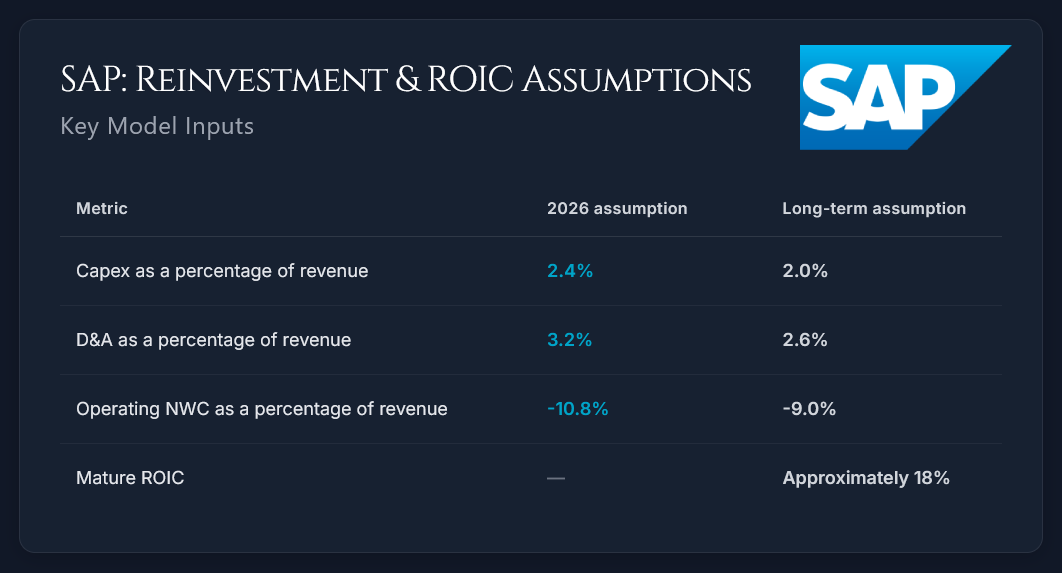
Near-term capex remains elevated because SAP continues investing in cloud and sovereign-cloud infrastructure.
D&A stays above capex because it includes depreciation of leased assets and amortisation of acquired intangible assets. The terminal-value calculation separately includes a sustainable reinvestment requirement, so this difference is not treated as permanent cost-free growth.
We cannot forget leases, which we treat as financing obligations. Right-of-use depreciation is added back through D&A, lease-principal payments are excluded from FCFF, and lease liabilities are deducted in the enterprise-to-equity bridge.
SAP also benefits from negative working capital because many customers pay subscription and support fees in advance. Operating working capital equalled approximately -10.8% of revenue in 2025. We gradually normalise this to -9.0% by 2035, reducing the funding benefit as SAP matures.
SAP’s estimated 2025 accounting ROIC was approximately 18% to 19%. The figure is affected by expensed R&D, negative working capital and acquisition goodwill, so we believe it shouldn’t interpreted too precisely.
We use an approximately 18% mature ROIC as a reasonableness check on SAP’s long-term reinvestment assumptions. The base-case terminal FCFF is calculated directly from normalised capex, lease reinvestment and working-capital requirements.
2.4 Free Cash Flow to the Firm (FCFF)
Free Cash Flow to the Firm represents the cash generated by SAP’s operations before payments to debt and equity investors.
We calculate it as:
FCFF = NOPAT + D&A - cash capex - lease reinvestment - ΔNWC
Because SAP operates with negative working capital, continued revenue growth releases cash and increases FCFF. This benefit gradually declines as the working-capital ratio normalises.
As we said above, leases are treated as financing obligations. Lease-principal payments are excluded from FCFF, lease liabilities are deducted as debt, and forecast right-of-use asset additions are deducted as lease reinvestment. We forecast lease reinvestment at 1.0% of revenue.
SBC remains an operating expense and isnt added back to cash flow.
Forecast FCFF
The table below shows full-year operating forecasts in € billions.
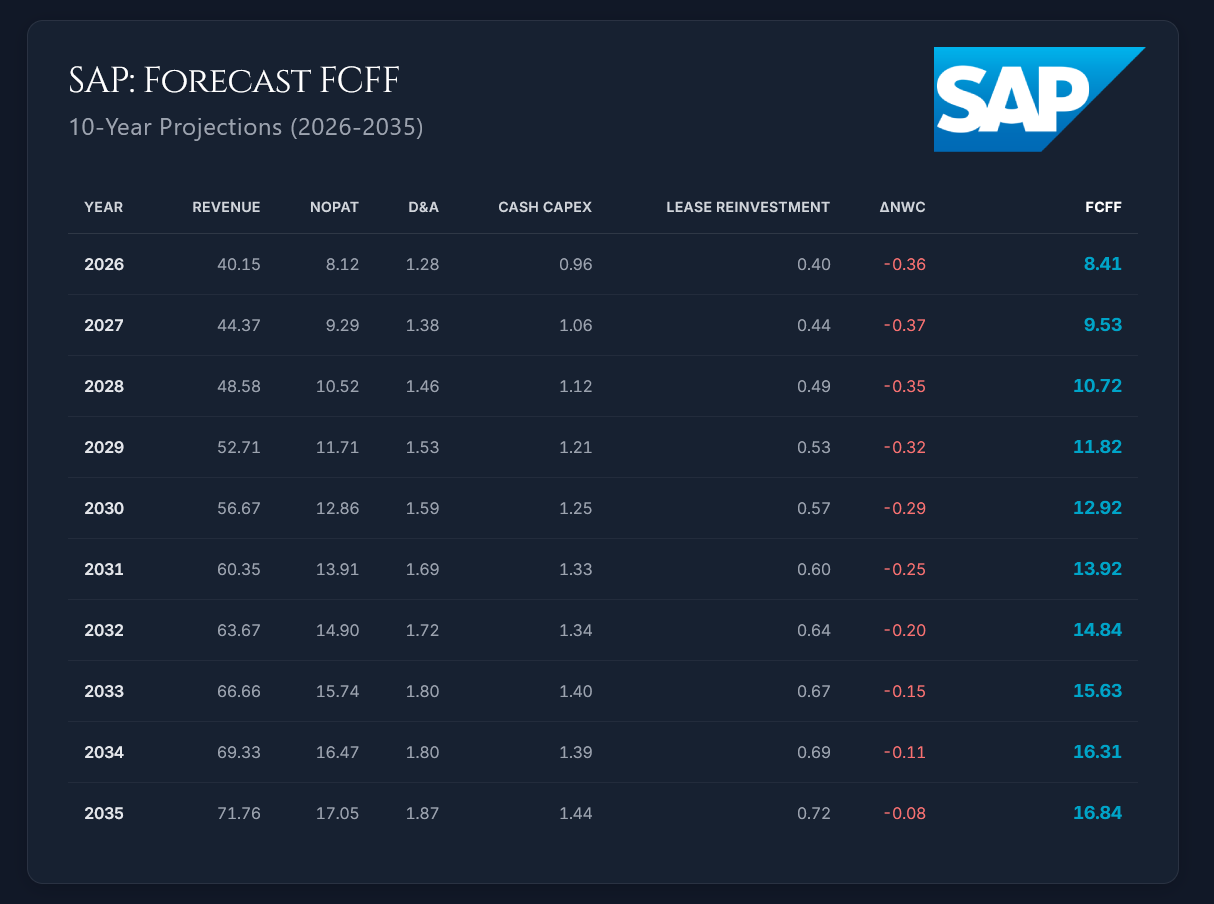
FCFF increases from €8.41 billion in 2026 to €16.84 billion in 2035, growing faster than revenue primarily because of operating-margin expansion.
Our 2026 FCFF estimate is below SAP’s approximately €10 billion company-defined FCF outlook. The measures are not directly comparable without reconciliation. SAP’s measure is derived from operating cash flow and deducts lease payments, whereas our FCFF is derived from NOPAT and treats leases as financing obligations while separately deducting lease reinvestment.
2.5 Discount Rate (WACC)
Because the DCF is prepared in euros, we use euro-denominated discount-rate inputs.
The cost of equity is calculated using the Capital Asset Pricing Model:
Cost of Equity = Risk-Free Rate + Beta x Equity Risk Premium
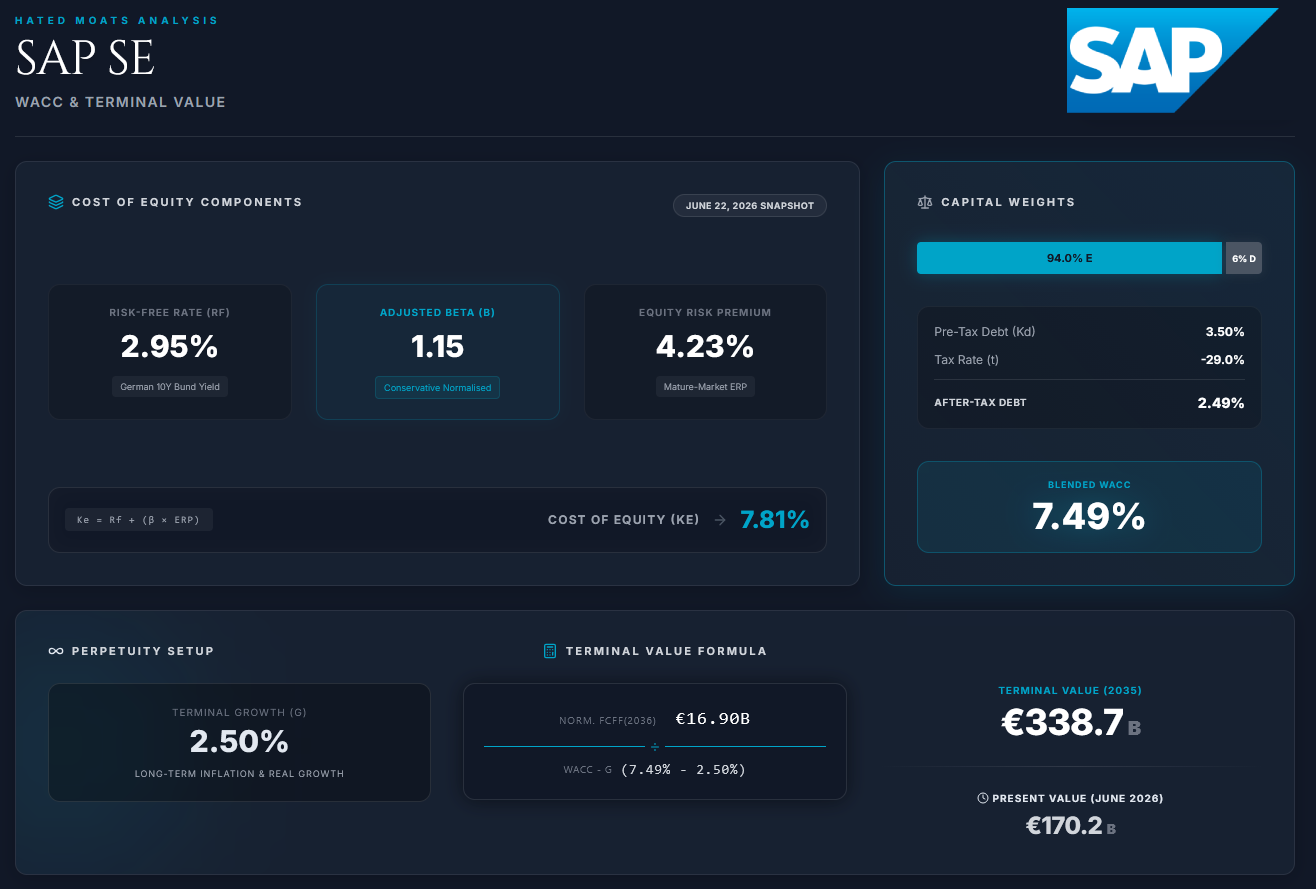
We use the German 10-year Bund yield of 2.95% on the June 22, 2026 valuation date and a mature-market equity risk premium of 4.23%.
We apply a conservative normalised beta of 1.15, intended to reduce reliance on SAP’s beta over any single regression period or relative to any single market index.
Cost of equity
Cost of equity = 2.95% + 1.15 x 4.23%
Cost of equity = 7.81%
SAP’s recent eurobond issuance and A1/A+ credit ratings support a 3.5% pre-tax cost of debt. After applying a 29% tax rate:
After-tax cost of debt
After-tax cost of debt = 3.50% x (1 - 0.29)
After-tax cost of debt = 2.49%
We assume a capital structure of 94% equity and 6% financial debt and leases.
WACC
WACC = 0.94 x 7.81% + 0.06 x 2.49%
WACC = 7.49%
2.6 Terminal Value
We use the perpetuity-growth method with a terminal growth rate of 2.5%, reflecting long-term inflation and modest real growth.
This is below the 3.5% revenue growth assumed in 2035, allowing SAP to mature further beyond the explicit forecast period.
For 2036, we assume:
Revenue growth of 2.5%
An IFRS EBIT margin of 33%
An operating tax rate of 28%
D&A equal to 2.0% of revenue
Cash capex equal to 2.0% of revenue
Lease reinvestment equal to 1.0% of revenue
Operating working capital equal to -9.0% of revenue
2036 revenue is approximately €73.55 billion, producing NOPAT of approximately €17.48 billion.
Normalised 2036 FCFF is calculated directly from the long-term reinvestment assumptions:
Normalised 2036 FCFF
= NOPAT + D&A - cash capex - lease reinvestment - ΔNWC
= €17.48bn + €1.47bn - €1.47bn - €0.74bn + €0.16bn
= approximately €16.90 billion
The approximately €0.16 billion working-capital contribution reflects the increase in SAP’s negative operating working-capital balance as revenue grows.
Terminal value
= €16.90 billion / (7.49% - 2.5%)
= approximately €338.7 billion
Discounted from the end of 2035 to the June 22, 2026 valuation date:
Present value of terminal value
= approximately €170.2 billion
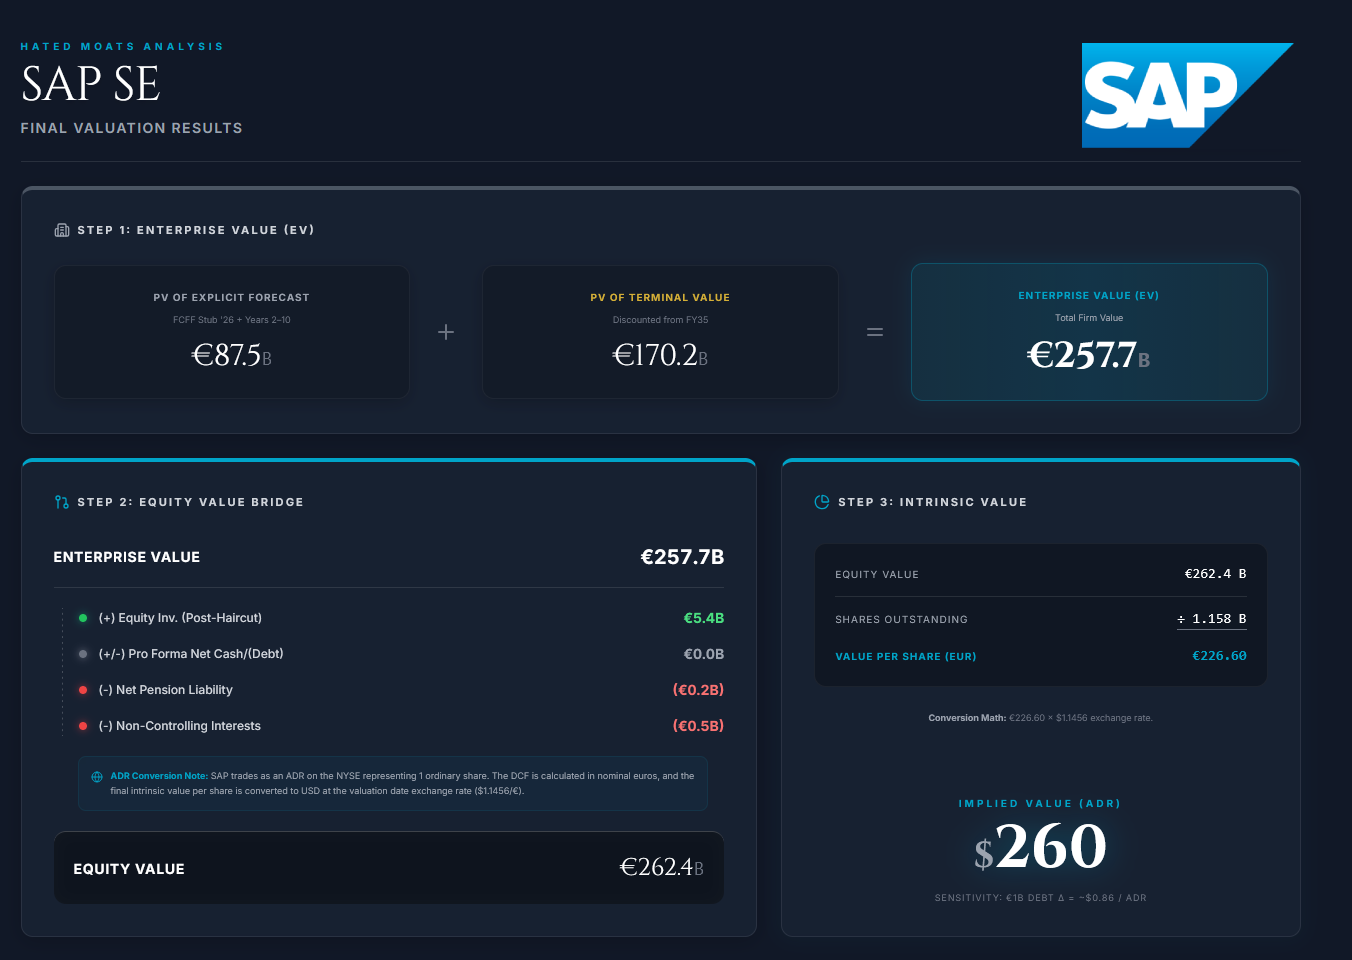
3. Results
The valuation is measured as of June 22, 2026. Because the operating forecast presents full-year cash flows, we estimate a separate stub-period cash flow for the remainder of 2026.
We use a mid-year convention for the explicit forecast and discount the terminal value from December 31, 2035.
Present Value of Cash Flows
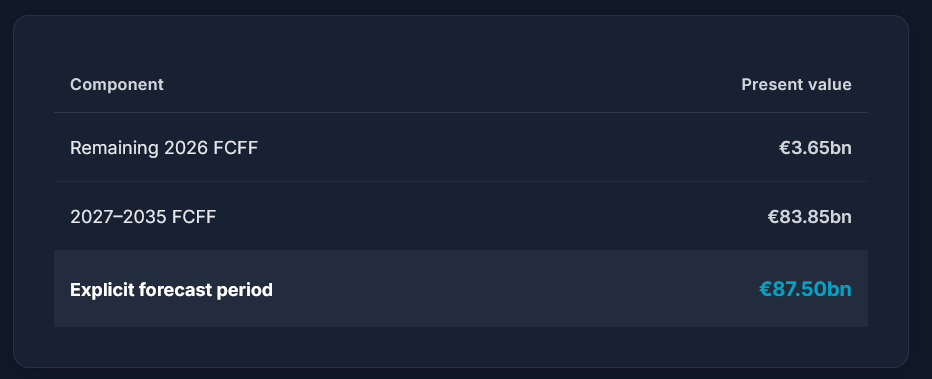
We estimate approximately €3.7 billion of FCFF for the remainder of 2026, based on SAP’s full-year forecast and seasonal cash-flow profile.
The explicit forecast period contributes approximately €87.5 billion to enterprise value.
The terminal value, as calculated above, is approximately €338.7 billion. After discounting this value to June 22, 2026, its present value is approximately €170.1 billion.
Enterprise value
= €87.5 billion + €170.1 billion = approximately €257.7 billion
The terminal value represents approximately 66% of enterprise value, making the result particularly sensitive to SAP’s mature margin, WACC and perpetual growth rate.
Equity-Value Bridge
We assume approximately zero pro forma net cash or debt after considering SAP’s dividend, share repurchases, bond issuance and the undisclosed Reltio acquisition price. Equity investments are included at 80% of carrying value.
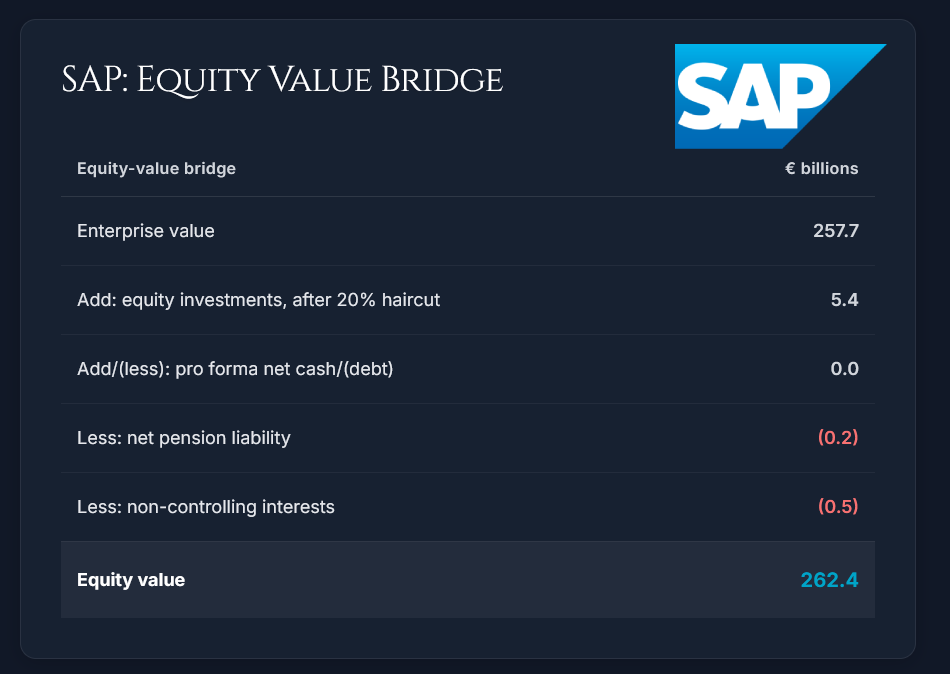
This produces an estimated equity value of €273.1 billion.
Each €1 billion change in pro forma net debt or acquisition consideration changes intrinsic value by approximately €0.86 per diluted share.
Intrinsic Value per Share
We use approximately 1.158 billion diluted shares, including outstanding dilutive awards.
= €262.4 billion / 1.158 billion
= approximately €226.60
Using the exchange rate of $1.1456 per euro and SAP’s one-for-one ADR ratio:
Intrinsic value per ADR = €226.60 × 1.1456 = approximately $260
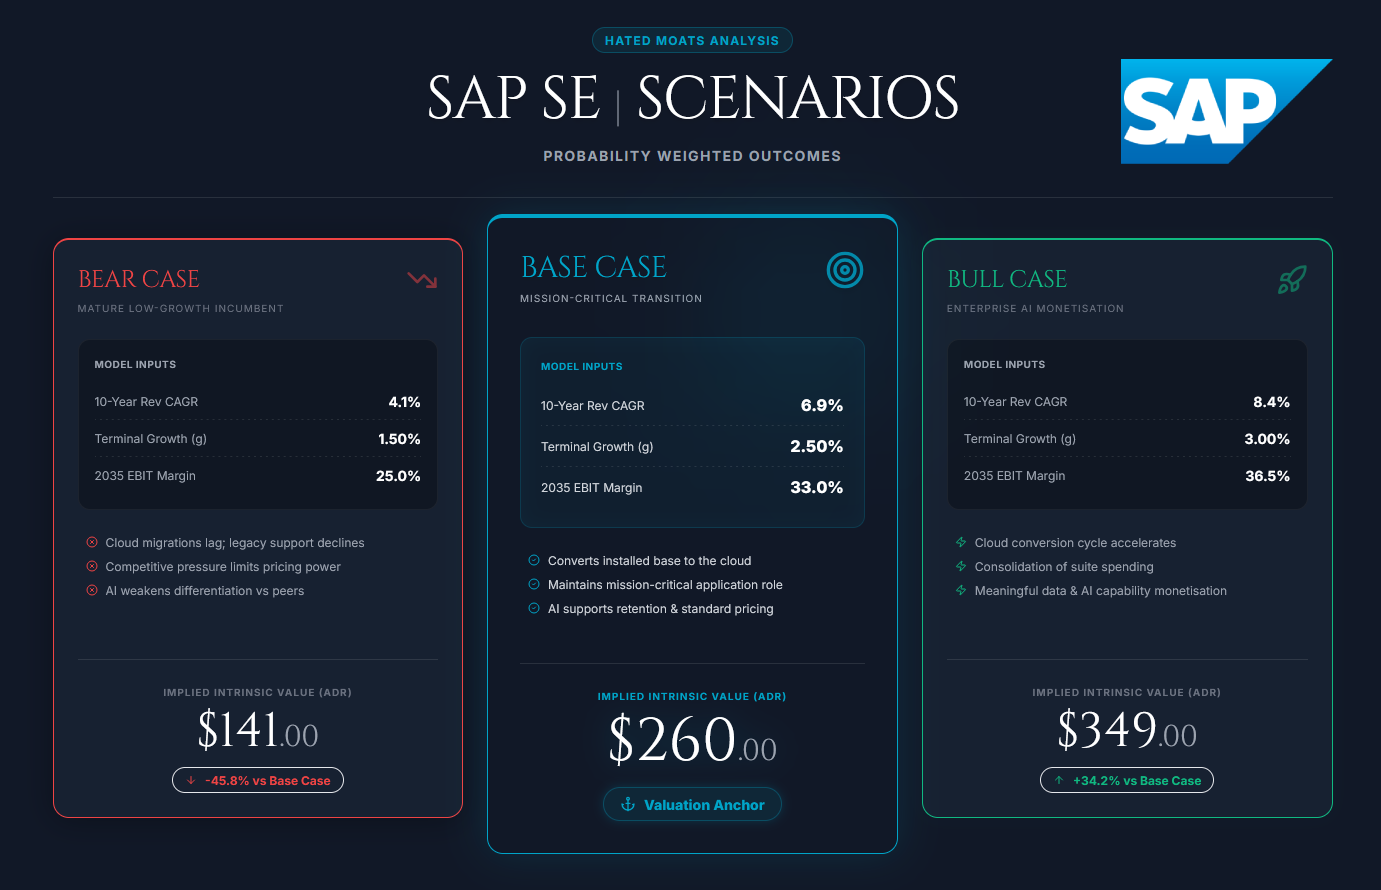
4. Scenarios
The scenarios test different operating outcomes while holding the WACC at 7.49%. This isolates changes in business performance from changes in market discount rates.
All scenarios use the same valuation date, equity-value bridge, diluted share count, exchange rate and lease-reinvestment assumption.
Bear Case: $141 per share
Cloud migrations take longer, legacy support declines faster and competitive pressure limits pricing power. AI improves customer productivity but weakens differentiation across traditional enterprise-software functions.
Revenue grows at a ten-year CAGR of 4.1%, while the IFRS EBIT margin declines to 25% and SAP’s negative working-capital advantage gradually fades.
SAP remains profitable and strategically relevant but increasingly resembles a mature, low-growth software incumbent.
Base Case: $260 per share
SAP converts much of its installed customer base to the cloud while maintaining its position across mission-critical enterprise applications.
Revenue grows at a 10-year CAGR of 6.9%, while operating leverage expands the IFRS EBIT margin to 33%. AI supports retention, pricing and suite adoption but is not treated as a separate hypergrowth business.
Bull Case: $349 per share
Cloud conversion accelerates, customers consolidate more spending within SAP’s suite and the company meaningfully monetises its enterprise data and AI capabilities.
Revenue grows at a ten-year CAGR of 8.4%, while stronger product economics and internal automation expand the IFRS EBIT margin to 36.5%.
This outcome requires SAP to strengthen its control of the enterprise application and data layer while translating AI into greater customer spending and pricing power.
5. Conclusion: Margin of Safety & Final Verdict
Margin of Safety = 1 - (Current Price / Intrinsic Value)
Margin of Safety = 1 − ($155.09 / $260)
Margin of Safety = 40.4%
Based on our valuation scale, SAP becomes:
Undervalued below $221, representing a 15% margin of safety.
Deeply undervalued below $156, representing a 40% margin of safety.
At approximately $155 per ADR, SAP falls marginally within our deeply undervalued range.
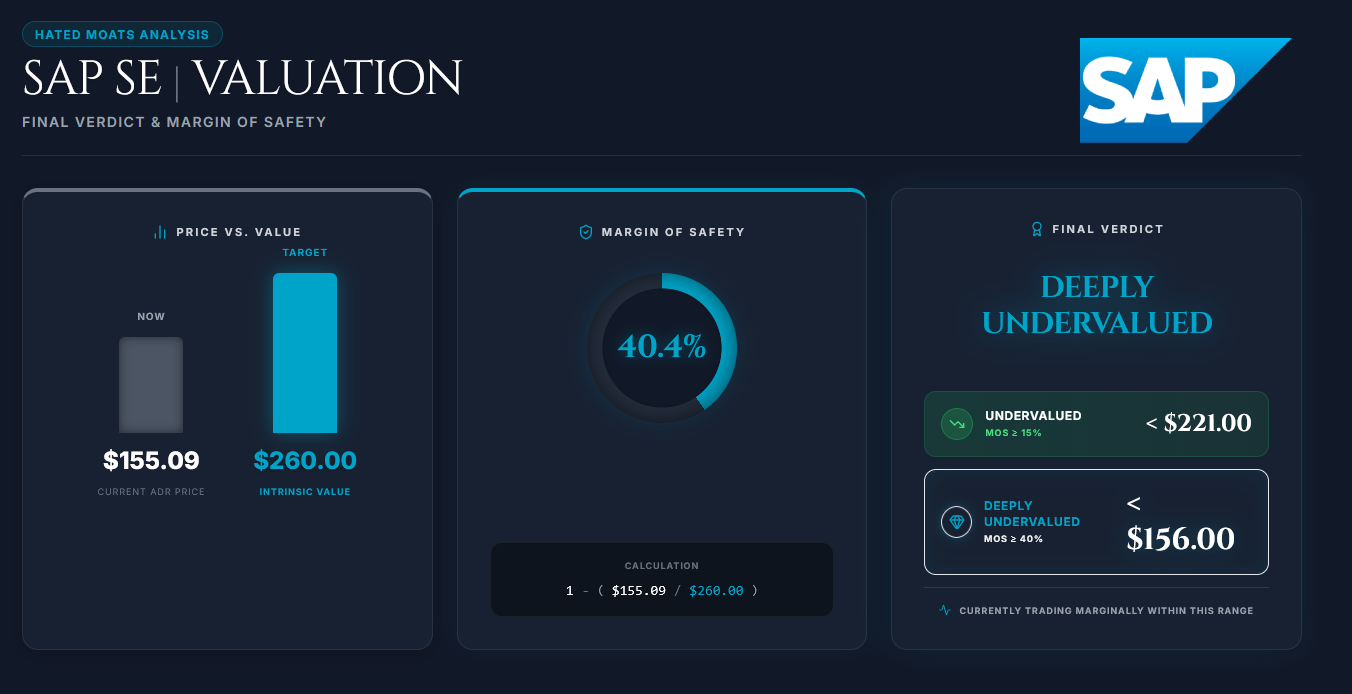
Final Verdict: Deeply Undervalued
The current price appears to reflect substantial concern about SAP’s cloud transition, declining legacy revenue and potential AI disruption.
These risks are real, but SAP remains deeply embedded in mission-critical enterprise processes, making replacement costly, complex and operationally risky.
Our base case doesn’t require SAP to dominate enterprise AI. It assumes that SAP retains its core application and data position, converts much of its installed base to the cloud and expands margins through operating leverage. In other words, nothing fancy, really…
At $155, SAP trades only modestly above our $141 bear-case value. The shares therefore appear deeply undervalued under our base case, but offer limited protection if the bear case materialises.
The central question is whether SAP can preserve its position at the core of enterprise operations through the cloud and AI transition.
We’ll look at that question in great detail in our upcoming deep dive analysis of the company!
Disclosure
This article is for informational purposes only and does not constitute investment advice or a recommendation to buy or sell any security.
Really like the Damodaran style of your DCF ! ;)
Keep it like this ! 👍
For SAP I really wonder if they will be able to increase margins from there.
Great analysis! SAP is so deeply embedded in critical operating systems it is hard to replace without significant risk to supply chain failure. At these prices it's a no brainer!