
SoFi: DCF Valuation
SoFi might be finally becoming the bank Wall Street refused to believe in. What's the company's current valuation? - DCFriday #016

Date of Analysis: May 25 - 29, 2026
Verdict: Fairly Valued
Current Price Target (Base Case): $18
Price at the Time of Analysing: $18.22
1. Brief Overview
SoFi Technologies is a US digital financial platform that has evolved from its original student-loan refinancing roots into a broader, bank-chartered financial ecosystem.
The company now combines lending, deposits, investing, payments, credit products, financial-services tools and technology-platform revenue under one consumer-facing brand. With 14.7 million members, 22.2 million products, rapid revenue growth, GAAP profitability and a growing deposit-funded balance sheet, SoFi is increasingly being valued less as a speculative fintech and more as an emerging digital bank, though its investment case still depends on whether it can scale fee-based revenue, cross-sell efficiently and manage credit, funding and regulatory-capital risks through the cycle.
And how about the current valuation? Let’s have a look!

2. Discounted Cash Flow (DCF): Assumptions & Methodology
2.1 Revenue Forecast (Years 1-10)
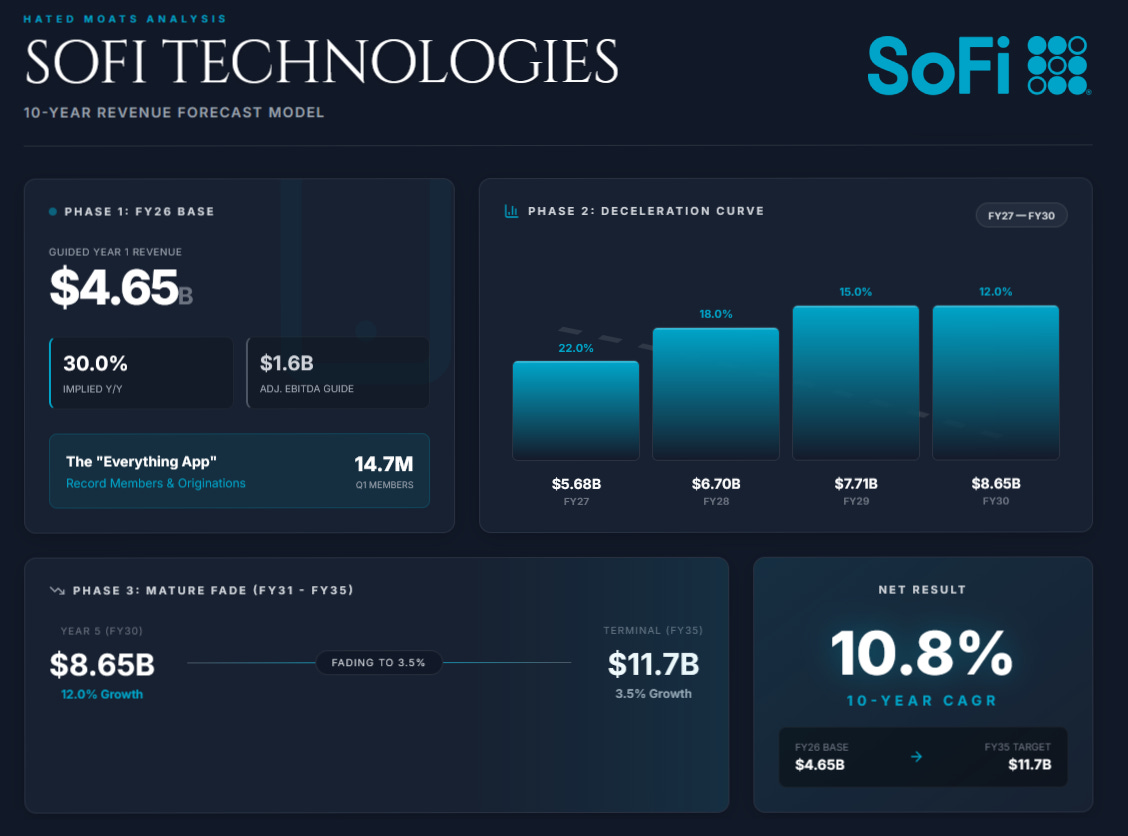
Year 1 (2026): 30%
We anchor our 2026 forecast directly to management’s latest full-year outlook. SoFi reaffirmed full-year 2026 guidance for adjusted net revenue of approximately $4.655 billion, implying roughly 30% annual growth, alongside at least 30% member growth, adjusted EBITDA of approximately $1.6 billion, adjusted net income of approximately $825 million, and adjusted EPS of approximately $0.60. This is also consistent with SoFi’s Q1 2026 momentum when the company reported $1.087 billion of adjusted net revenue, up 41% YoY, with record members, products, and originations.
We use adjusted net revenue rather than GAAP total net revenue to keep the forecast aligned with management’s guidance and operating framework. SoFi defines adjusted net revenue as total net revenue adjusted to exclude fair-value changes in servicing rights and residual interests classified as debt due to valuation-input and assumption changes, as well as gains and losses on debt extinguishment. This measure is not a substitute for GAAP revenue, but it is the metric management uses for its outlook and core operating performance discussion. SoFi’s Q1 2026 performance was supported by 35% member growth to 14.7 million, 39% product growth to 22.2 million, record total loan originations of $12.2 billion, and continued expansion of its Financial Services segment.
Years 2-5 (2027-2030): Deceleration from 22% to 12%
In this phase, we assume SoFi remains a high-growth financial platform but begins to decelerate as the base becomes larger. Our 2027 growth assumption of 22% is broadly consistent with current consensus-style estimates, which show average 2027 revenue growth of roughly 21.5%.
Growth in this period is supported by four factors:
Continued member acquisition from the “everything app” strategy.
Cross-sell into Money, Invest, Relay, Credit Card, Crypto, At Work, and lending products.
Expansion of the Loan Platform Business, which shifts more originations off-balance-sheet and increases fee-based revenue.
Continued funding advantage from deposits, which represented more than 90% of average liabilities in Q1 and created meaningful interest-expense savings versus warehouse funding.
By 2030, our model has SoFi reaching roughly $8.6-$8.7 billion of adjusted net revenue, depending on the exact interpolation between 22% growth in 2027 and 12% growth in 2030. We believe that is not a heroic assumption relative to SoFi’s current growth profile, but it assumes a meaningful slowdown from the present 30-40% growth environment.
Years 6-10 (2031-2035): Fading to 3.5%
In the terminal phase, revenue growth fades linearly from 9.0% in 2031 to 3.5% in 2035. This assumes that SoFi has matured from a hyper-growth fintech into a scaled digital financial institution with a large member base, broader product adoption, and a more stable revenue mix.
Under this growth path, adjusted net revenue reaches approximately $11.6-$11.8 billion by 2035, with an implied 2026-2035 CAGR of roughly 10.7-10.9%, depending on the exact interpolation between forecast years. All figures are modelled in USD.
2.2 Profitability (Normalised Pre-Tax Operating Profit → NOPAT)
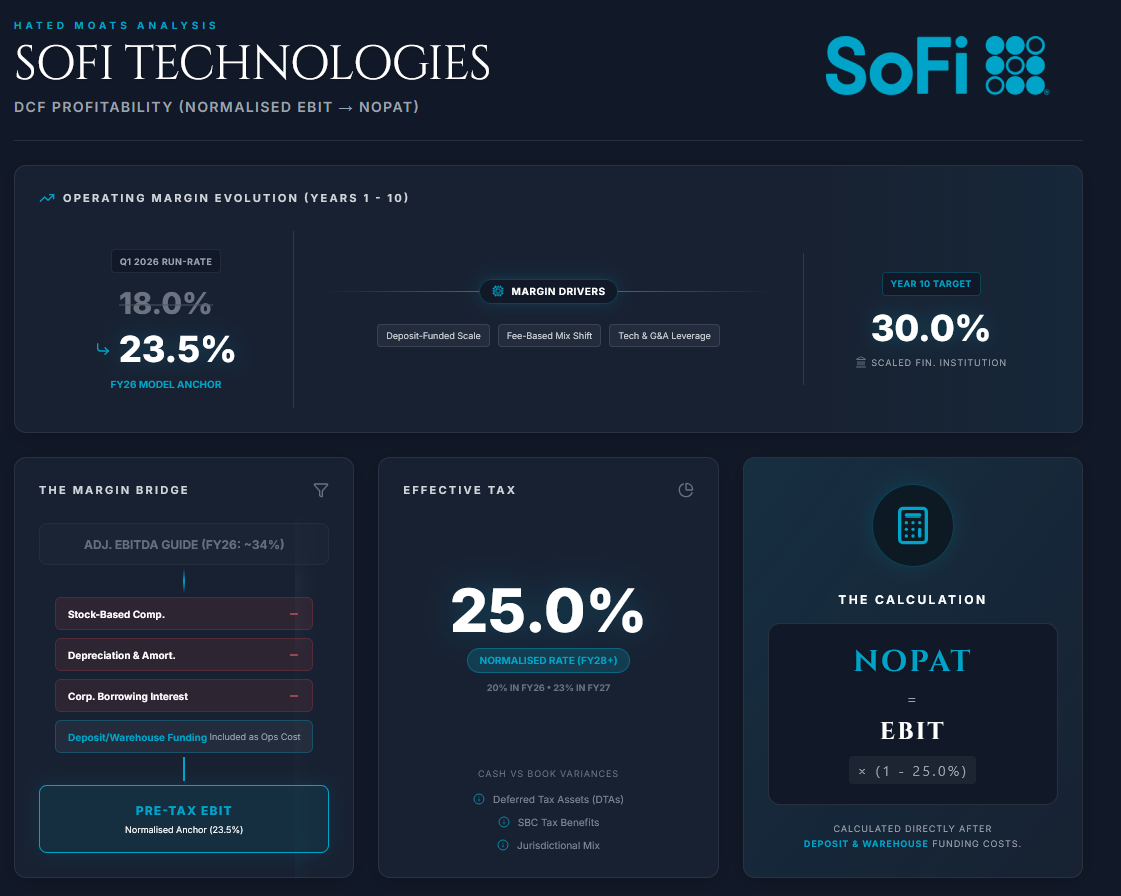
The transition from adjusted EBITDA to normalised pre-tax operating profit is critical in our analysis. SoFi’s adjusted EBITDA margin is already high, with management guiding to approximately 34% adjusted EBITDA margin in 2026. However, adjusted EBITDA excludes costs that matter economically for valuation, including stock-based compensation, depreciation and amortisation, taxes, corporate borrowing interest, and certain fair-value or non-recurring adjustments. Because SoFi is a hybrid fintech and financial-services platform, we treat deposit, warehouse and securitisation funding costs as operating costs rather than adding them back. Our model therefore uses a normalised pre-tax operating margin to capture the true cost of running and scaling the business.
Start Normalised Pre-Tax Operating Margin: 23.5%
We model a starting normalised pre-tax operating margin of 23.5% in 2026. This sits below the guided adjusted EBITDA margin but above SoFi’s Q1 2026 pre-tax margin of roughly 18%, because management’s full-year adjusted net income guidance implies a stronger full-year profitability profile than Q1 alone. In Q1 2026, SoFi reported $166.7 million of GAAP net income, and adjusted net income was the same amount for the quarter. Against $1.087 billion of adjusted net revenue, this equalled an adjusted net income margin of roughly 15%, while full-year guidance implies approximately 18% adjusted net income margin.
We assume SoFi continues to benefit from operating leverage in technology, product development, servicing, member acquisition, and G&A. We also assume the Loan Platform Business and broader fee-based revenue mix gradually improve the quality of revenue.
Long-Run Normalised Pre-Tax Operating Margin Path: Expands to 30.0% by Year 10
The expansion to a 30.0% EBIT margin by 2035 is driven by three factors:
1.) Deposit-funded scale
The bank charter allows SoFi to fund lending with member deposits rather than relying entirely on more expensive warehouse or capital-market funding. In Q1 2026, average total deposits represented over 90% of average total liabilities, and the average rate paid on deposits was 155 basis points lower than the rate paid on warehouse facilities, which management said translated into approximately $621.8 million of annualised interest-expense savings.
2.) Fee-based revenue mix shift
Fee-based revenue reached $386.8 million in Q1 2026, with the largest components including loan platform fees, loan origination fees, technology services, interchange and brokerage. These revenue streams should require less balance-sheet capital than retained lending assets.
3.) Operating leverage
A digital financial platform should be able to scale revenue faster than fixed product, engineering, compliance, and G&A costs, although we don’t give SoFi software-company margins because it remains exposed to credit, regulation, capital requirements, and the consumer cycle.
Tax Rate: 25.0%
SoFi is now consistently profitable, with Q1 2026 marking its 10th consecutive quarter of GAAP profitability. We therefore don’t assume a long period of near-zero economic tax expense, although actual cash taxes may differ from book taxes because of deferred tax assets, stock-compensation tax benefits and jurisdictional mix. We use a transitional tax rate of 20% in 2026, 23% in 2027, and a normalised 25% from 2028 onward.
NOPAT Calculation
NOPAT = Normalised pre-tax operating profit x (1 - Tax Rate).
For SoFi, this operating profit measure is calculated after deposit, warehouse and securitisation funding costs, because as we mentioned above, those are operating costs of the lending model, and we believe this is the sound methodology.
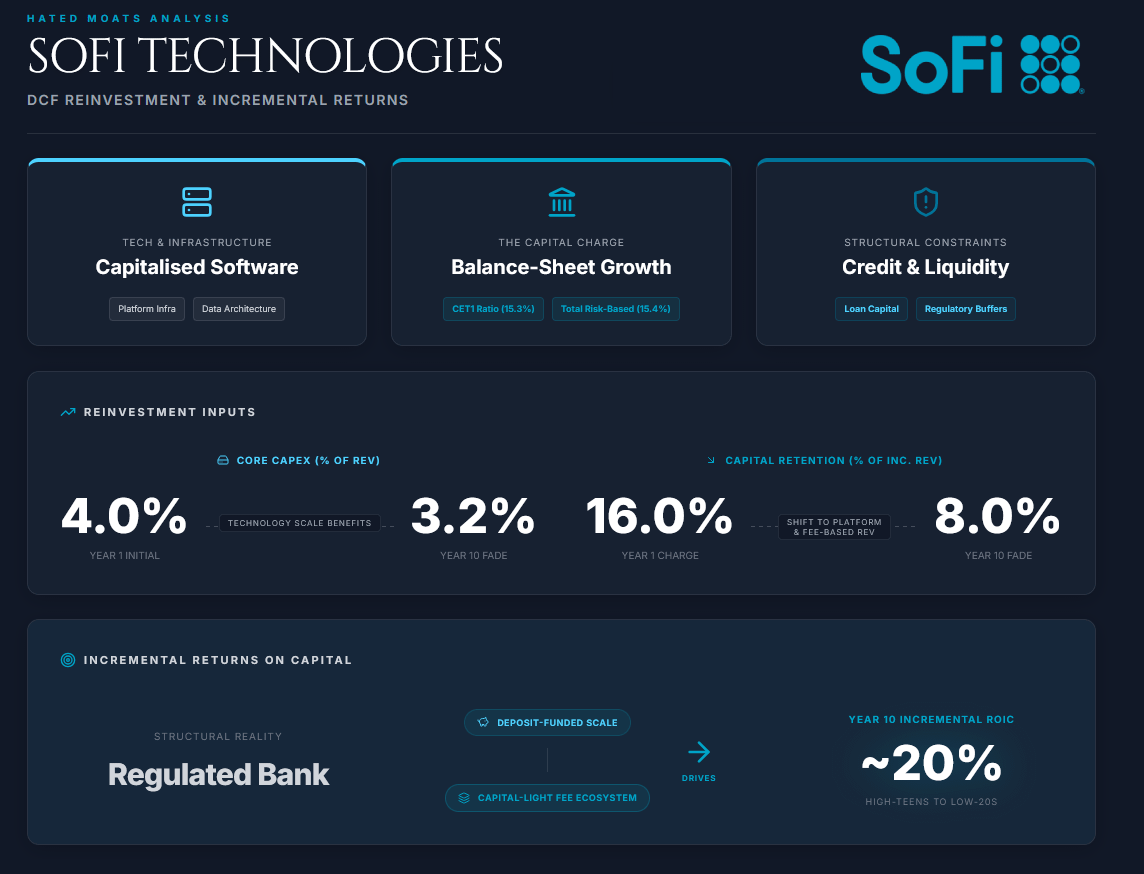
2.3 Reinvestment & Incremental Returns
SoFi is a digital financial institution with a bank charter, a lending balance sheet, a technology platform, and a growing fee-based ecosystem. This makes reinvestment more complicated than in a normal marketplace DCF, because growth requires both technology investment and sufficient balance-sheet capital to support loans, deposits, liquidity and regulatory requirements.
Capex
We model core technology and infrastructure capex at 4.0% of revenue initially, fading to 3.2% by Year 10.
This spend reflects internal software, platform infrastructure, compliance systems, data architecture, product development, security and operational technology (and we hope we didn’t forget any other major spend :). SoFi’s balance sheet already shows property, equipment and software of $448.5 million as of Q1 2026, up from $416.4 million at year-end 2025, while the cash-flow statement shows continued purchases of property, equipment and software. This supports the view that technology and infrastructure investment remain real ongoing cash needs, even though they are not the largest source of balance-sheet reinvestment.
Balance-Sheet Capital Reinvestment
For SoFi, reinvestment isn’t mainly classical working capital. The more relevant charge is balance-sheet capital needed to support growth in loans, deposits, servicing assets, liquidity and regulated banking activities.
We model balance-sheet capital reinvestment at 16% of incremental revenue initially, fading to 8% by Year 10. This should be understood as an economic capital-retention charge, not a forecast of gross loan funding needs.
This is intentionally more conservative than for an asset-light software platform. Even with the Loan Platform Business shifting some originations off-balance-sheet, SoFi still needs capital for credit exposure, compliance, liquidity and banking infrastructure. As of Q1 2026, SoFi Bank reported a CET1 ratio of 15.3%, a total risk-based capital ratio of 15.4%, and a Tier 1 leverage ratio of 12.8%. That’s comfortably above required levels, but still relevant constraints on long-term balance-sheet growth.
Incremental Returns on Reinvested Capital
A conventional ROIC framework is less clean for SoFi because deposits, loans and funding costs are part of the operating model. However, incremental returns should improve if fee-based revenue, Loan Platform Business revenue and member monetisation grow faster than balance-sheet-heavy retained lending.
We therefore model incremental returns improving over time as SoFi shifts from capital-intensive growth toward growth driven by member scale, deposit funding and fee-based monetisation.
By Year 10, returns on incremental reinvested capital approach the high-teens to low-20s range, but again, we don’t assume software-like returns because credit exposure, liquidity requirements and regulatory capital remain structural constraints.
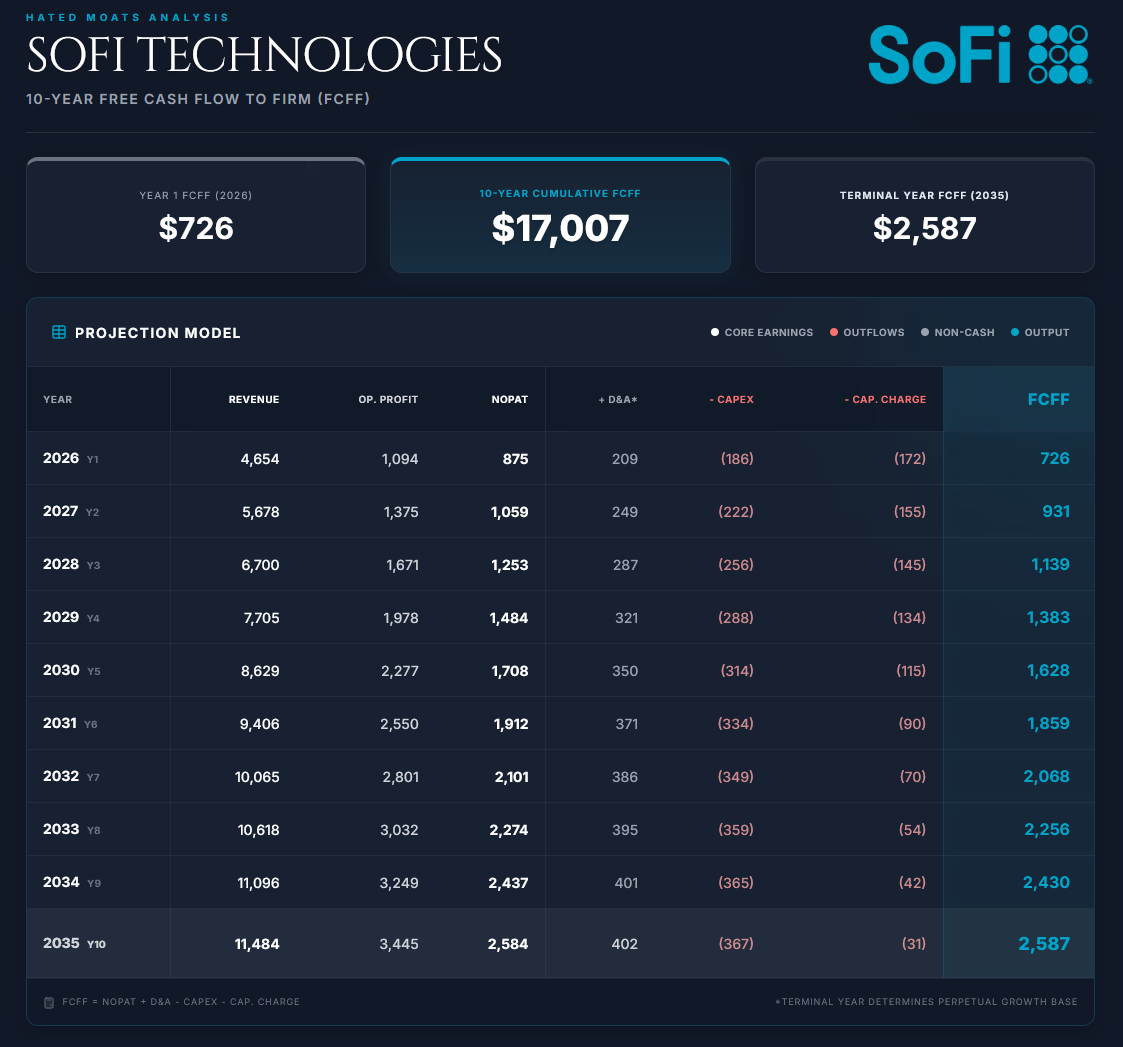
2.4 Free Cash Flow to the Firm (FCFF)
The formula used is:
FCFF = NOPAT + D&A - Core Capex - Balance-Sheet Capital Reinvestment
All figures below are in USD millions. NOPAT is calculated from normalised pre-tax operating profit, not from conventional industrial-company EBIT. The balance-sheet reinvestment line should be read as an economic capital-retention charge rather than classical receivables/payables working capital.
2.5 Discount Rate (WACC)
The Weighted Average Cost of Capital serves as the hurdle rate for our cash flows. We construct this using market-based inputs current as of late May 2026.
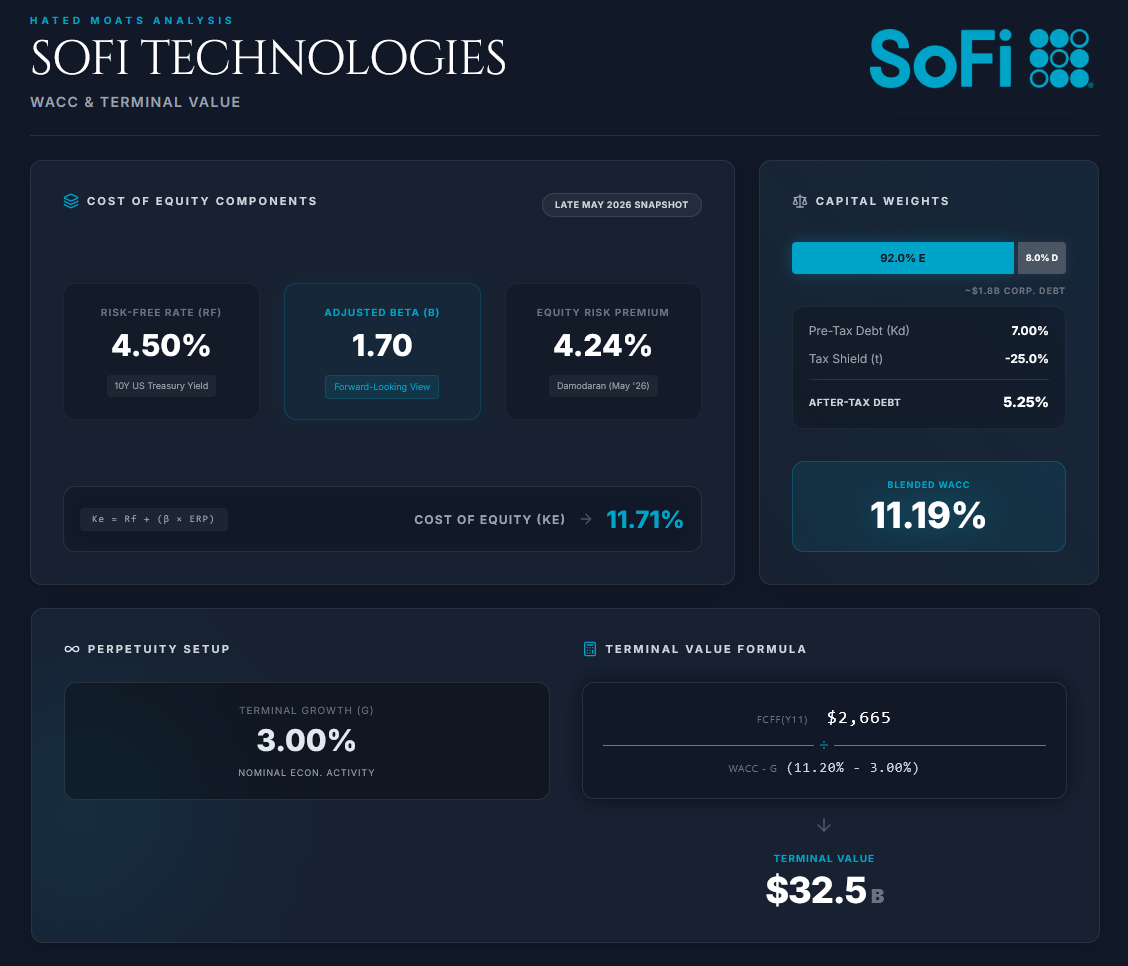
Risk-Free Rate (Rf): 4.50%
We use approximately 4.50%, broadly in line with late-May US 10-Year Treasury data.
Equity Risk Premium (ERP): 4.24%
We use Damodaran’s latest implied US equity risk premium estimate available as of late May 2026. His 1 May 2026 estimate was 4.24% based on trailing 12-month adjusted payout, using a 4.40% US Treasury rate.
Beta (β): 1.70
Raw SOFI beta screens currently show a high beta, around 2.13. We don’t use the raw figure directly because SoFi’s short public history, SPAC-era volatility, retail-trading intensity, and capital-raise overhang likely overstate the mature-business beta.
Instead, we apply a forward-looking adjusted beta of 1.70, which still treats SoFi as a high-risk, high-volatility financial growth stock.
Cost of Equity (Ke)
Ke = Rf + β x ERP
Ke = 4.50% + 1.70 x 4.24%
Ke = 11.71%
Pre-Tax Cost of Debt (Kd): 7.00%
SoFi has a higher cost of capital than mature banks or megacap platforms because it’s still a growth financial stock with credit-cycle exposure. We use 7.0% as the pre-tax cost of debt.
This should be read as the cost of corporate debt capital, not as the cost of deposits. Deposit funding costs are already reflected in SoFi’s operating economics and should not be double-counted in WACC.
Tax Shield: 25%
We use the same normalised marginal tax rate as in the NOPAT calculation. This is more consistent than using only the 21% US federal statutory rate, because the model already assumes a 25% normalised long-run tax rate.
After-Tax Cost of Debt
Kd x (1 - t) = 7.00% x (1 - 0.25) = 5.25%
Capital Structure
At the price of $15.62 (May 26, 2026), SoFi’s equity value is approximately $21.5 billion using the Q1 2026 diluted weighted-average share base of roughly 1.378 billion shares. Q1 2026 total debt was approximately $1.813 billion.
For WACC purposes, we exclude deposits from debt because deposit funding costs are already embedded in SoFi’s operating economics.
We use approximately:
92% Equity / 8% Debt
WACC Computation
WACC = (0.92 x 11.71%) + (0.08 x 5.25%)
WACC = 10.77% + 0.42%
WACC = 11.19%
In this way, our final used WACC is 11.2%.
2.6 Terminal Value
We calculate the Terminal Value using the Perpetuity Growth Method, assuming the business continues indefinitely as a going concern.
Terminal Growth Rate (g): 3.0%
This is set below long-term nominal GDP assumptions and reflects the view that SoFi, once mature, should grow broadly in line with nominal economic activity plus modest share gains from legacy banks. We don’t use a higher terminal growth rate because we believe that financial services remain competitive, regulated and cyclical.
The formula used is:
TV = FCFF(n+1) / (WACC - g)
The calculation is as follows:
FCFF(Y11) = FCFF(Y10) x (1 + g)
FCFF(Y11) = 2,587 x 1.03 = 2,665
Then:
TV = 2,665 / (0.112 - 0.030)
TV = 2,665 / 0.082
TV = $32,495 million
3. Results
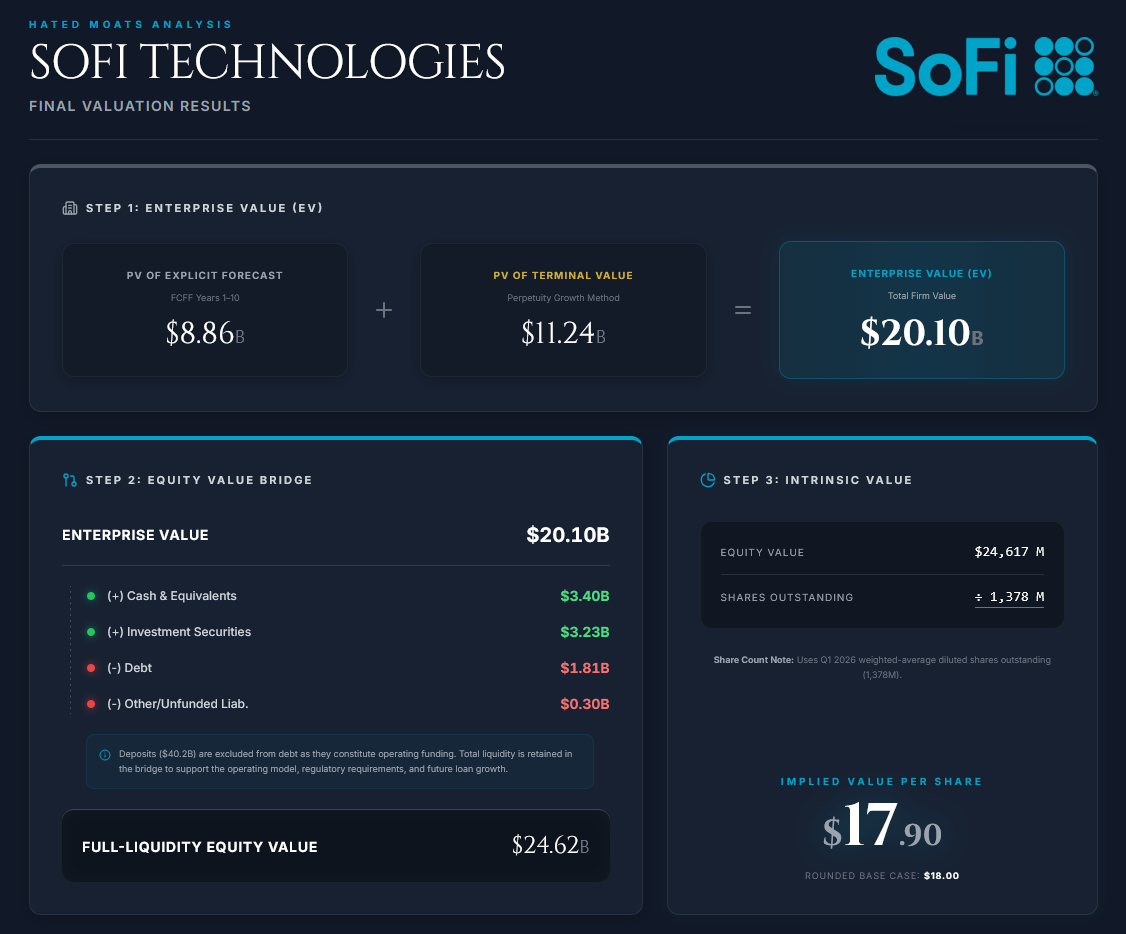
We sum the present value of the explicit forecast-period cash flows and the present value of the Terminal Value to arrive at Enterprise Value.
PV of FCFF: Years 1-10
Using the 11.2% WACC discount factors:
Sum PV(FCFF) = $8,857 million
Then:
PV of Terminal Value = $11,240 million
Enterprise Value
8,857 + 11,240 = $20,098 million
Equity Value Bridge
Enterprise Value: $20,098M
(+) Cash & Cash Equivalents: $3,401M
(+) Investment Securities: $3,231M
(-) Debt: $1,813M
(-) Other / Unfunded Liabilities: $300M model assumption
Full-Liquidity Equity Value: $24,617M
Important adjustment is that we do not subtract deposits as debt. For SoFi, deposits are operating funding, similar to a bank, not ordinary corporate debt. SoFi reported $40.243 billion of deposits as of 31 March 2026.
However, we also don’t treat the entire liquidity position as excess cash in the way we would for an asset-light software company. Cash, securities and liquidity support the operating model, regulatory requirements, deposits and future loan growth. Therefore, the bridge above should be interpreted as a full-liquidity equity value, not a clean excess-cash-adjusted equity value.
Intrinsic Value per Share
Diluted shares outstanding: 1,378 million weighted-average diluted shares in Q1 2026.
Value per share:
24,617 / 1,378 = $17.9
Rounded intrinsic value: $18 per share
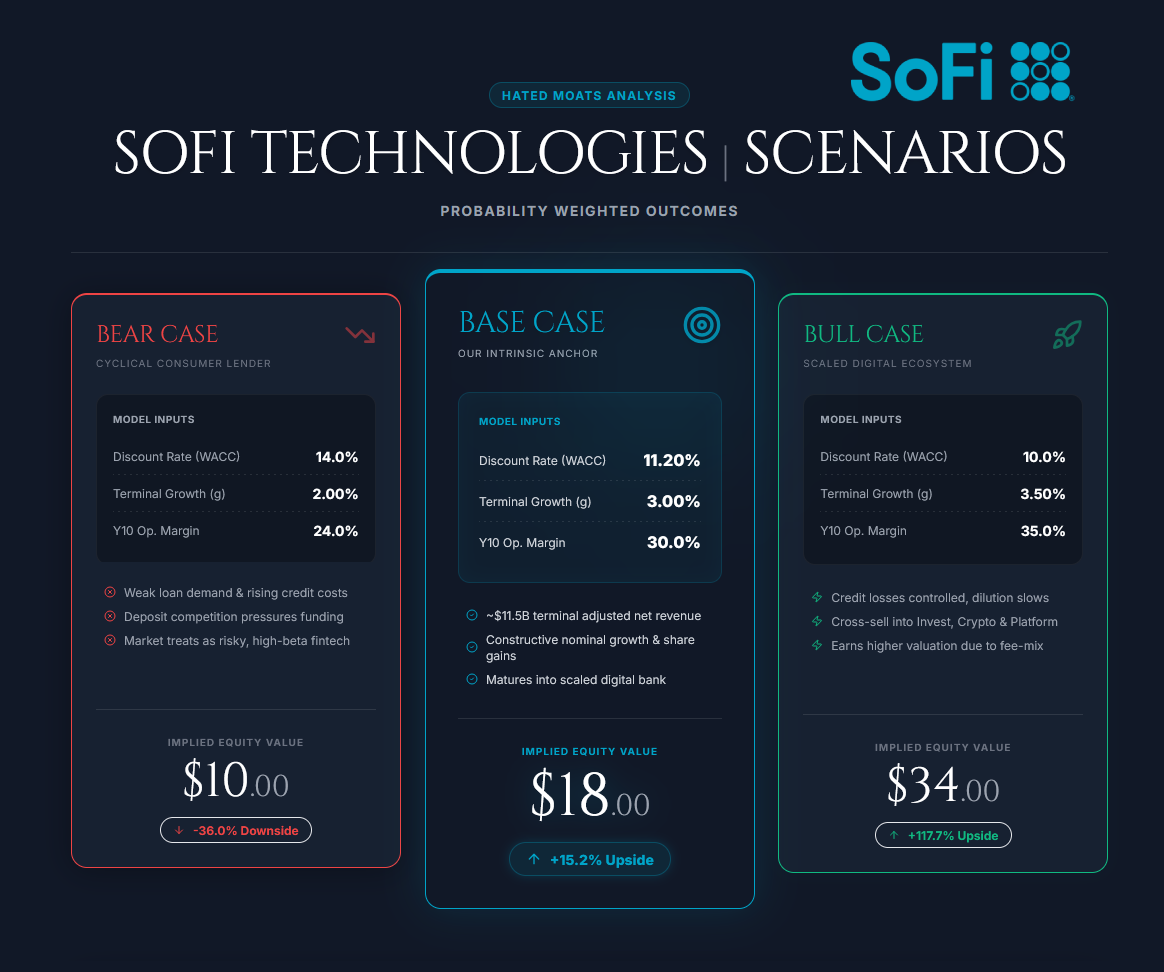
4. Scenarios
Bear Case: $10 per share
Inputs
WACC rises to 14.0% because the market continues to treat SoFi as a high-beta, credit-sensitive fintech rather than a maturing digital bank. Terminal growth falls to 2.0%.
Revenue growth slows materially after 2026 as loan demand weakens, credit costs rise and competition for deposits pressures funding costs. Under this scenario, adjusted net revenue reaches $8.708 billion in 2035. Normalised pre-tax operating margins cap at 24.0% rather than expanding to 30.0%.
Outcome
SoFi remains profitable, but the market values it more like a cyclical consumer lender with technology optionality rather than a premium digital financial platform.
This bear case is not a business-failure scenario but rather a scenario where SoFi keeps growing but receives limited valuation credit because investors remain concerned about credit cyclicality, funding costs, dilution and regulatory capital intensity.
Base Case: $18 per share
As modelled above: WACC of 11.2%, terminal growth of 3.0%, long-run normalised pre-tax operating margin of 30.0%, and 2035 adjusted net revenue of $11.484 billion.
Bull Case: $34 per share
Inputs
WACC compresses to 10.0% as SoFi proves that credit losses are controlled, dilution slows and fee-based revenue becomes a larger share of the mix. Terminal growth rises to 3.5%.
Revenue growth remains above 20% for longer, supported by cross-sell, SoFi Plus, Invest, digital assets, Big Business Banking, stablecoin-related infrastructure and the Loan Platform Business. Under this scenario, adjusted net revenue reaches $17.873 billion in 2035. Long-run normalised pre-tax operating margins expand to 35.0% as SoFi becomes a high-efficiency, deposit-funded digital financial platform.
Outcome
The stock re-rates from “risky fintech lender” to “scaled digital financial ecosystem.”
This bull case still doesn’t require pure software-company economics. The key difference is that SoFi earns a higher valuation because a larger share of incremental growth comes from fee-based revenue, member monetisation, platform services and capital-light financial infrastructure rather than retained lending alone.
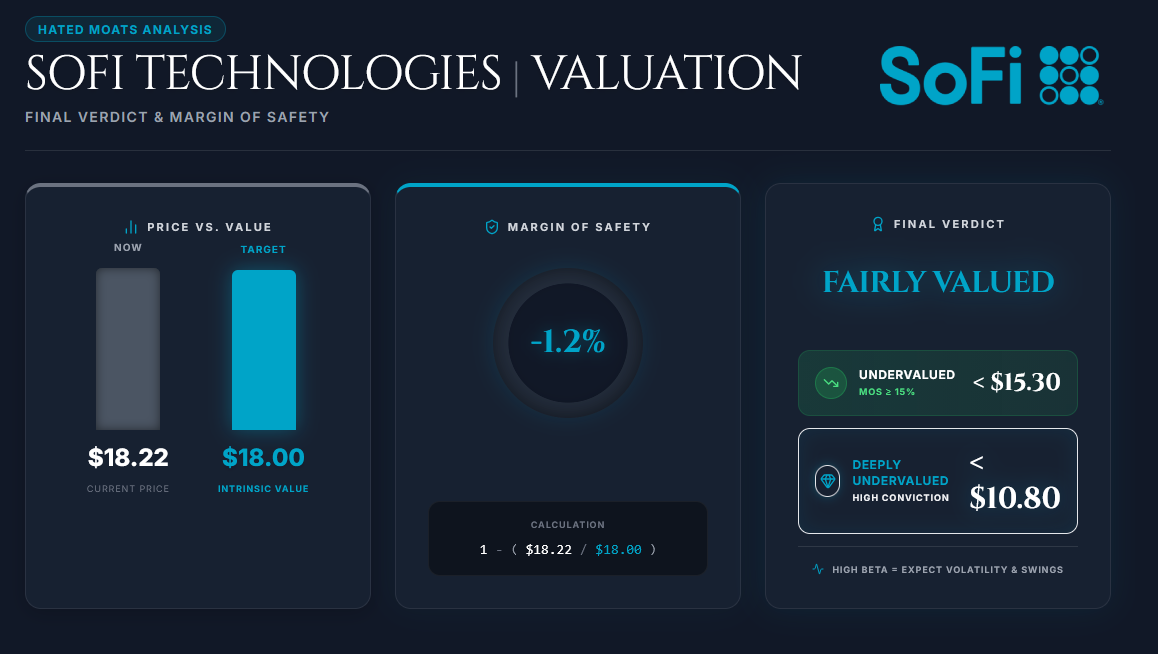
5. Conclusion: Margin of Safety & Final Verdict
Margin of Safety = 1 - (Current Price / Intrinsic Value)
Margin of Safety = 1 - ($18.22 / $18)
Margin of Safety = -1.22%
This margin of safety places the stock in exactly the farily valued category based on our defined scale. Due to high beta, the stock price can swing quite a bit - at the start of our analysis, for example, the stock price was at $16 per share, which gives MoS of 11.1%, i.e. slightly undervalued category.
In our scale, SoFi becomes undervalued below $15.3 per share (MoS = 15%) and deeply undervalued at $10.8 per share
Final verdict: Fairly Valued
… but with a fairly big variance and swings to undervalued territory can / should be expected.
SoFi is no longer just a student-loan refinancing story or SPAC-era fintech. It is now a profitable, deposit-funded digital financial platform with real scale, strong member growth, expanding fee-based revenue and a bank-charter funding advantage.
At the current price (May 29, 2026 close) of $18.22, the stock falls in basically exact farily valued category in our book. The upside remains meaningful if SoFi proves that cross-sell, fee-based revenue and operating leverage can turn it into a durable digital financial compounder, but our base case already gives the company meaningful credit for that transition.
For valuation-driven investors, the stock becomes cleaner below roughly $15.3, and substantially more attractive in the low teens unless future results justify higher margins, lower capital intensity or a lower cost of capital.
Our Strategy
We’ve been observing the company on the sidelines for quite some time and like its growth. We believe it’s an interesting choice for investors with high conviction in the business that are leaning towards the bull case scenario in their conviction. We haven’t done a truly deep dive into the company as a whole for it to be a case of “wonderful company at a fair price” for us right now, but we do acknowledge that for investors that did their DD and built a strong conviction in the name, it still might be an interesting area to accumulate.
We don’t sell put options in this case as a way of possible position initiation, since the premiums are too small in the Margin of Safety area where we’d happily start a position, i.e. around $12.6 per share (MoS = 30%).
Disclosure
The author of this article does not hold a position in the security of SoFi Technologies Inc. at the time of publishing this valuation. This article is for informational purposes only and does not constitute investment advice or a recommendation to buy or sell any security.
Incredibly cautious and conservative vs my view on their future revenues, I think they will grow 40+% in2027 and a CAGR of 26-32% in decent economic conditions for afew years after that, i think on those assumptions Sofi will eventually be a $40 stock in next 18months especially considering multiple premiums from hype cycles + likely S and P inclusion. Is my largest positon.
Great analysis