
Uber Technologies: DCF Valuation
The market is pricing Uber like a broken growth platform - is that true? - DCFriday #005

Date of Analysis: December 17-19, 2025
Verdict: Undervalued
Current Price Target (Base Case): $106
Price at the Time of Analysing: $79.31
1. Brief Overview
The divergence between market sentiment and fundamental reality for Uber Technologies has reached a critical point, creating, in our opinion, a classic “Hated Moat” opportunity. While the prevailing narrative remains fixated on regulatory friction and the existential, albeit distant, threat of autonomous vehicle (AV) displacement, the underlying financial engine has matured into a global logistics utility. The investment gist is straightforward. Uber has successfully transitioned from a cash-incinerating growth stock into the dominant liquidity pool for on-demand movement in the U.S. and many major Western urban markets. Now that’s a position that creates an immense barrier to entry for both local competitors and potential capital-intensive AV fleets.
The driver of future cash flows is no longer sheer user acquisition, but rather the compounding efficiency of the “Super App” ecosystem, where cross-selling between Mobility and Delivery, underpinned by the Uber One membership, can lower customer acquisition costs (CAC) and increase lifetime value (LTV).
Our 10-year Discounted Cash Flow (DCF) analysis yields a base-case intrinsic value of $106 per share. This valuation is anchored by conservative assumptions: revenue growth decelerating to 3.5% in the terminal phase and an explicit normalisation of tax rates to 25% as Net Operating Losses (NOLs) are progressively utilized over time.

2. Business & Financial Context
Uber Technologies operates one of the world’s largest multi-modal platforms for the movement of people and goods, functioning effectively as a massive, algorithmic matchmaker that creates value through liquidity. The business creates its “moat” through the Network Liquidity Effect. In a two-sided marketplace, the utility for both sides (drivers and riders) increases as the network grows. For riders, higher liquidity means lower wait times and competitive pricing. For drivers, it means higher utilisation rates and earnings per hour. This flywheel has become nearly insurmountable in Uber’s core markets, where it holds a dominant share.
The company reports through three primary segments: Mobility (ridesharing), Delivery (Uber Eats), and Freight. More on this in our deep dive about the company, that is in the making. The most significant shift in Uber’s financial context is the inflection in profitability. For Q3 2025, Uber reported an Adjusted EBITDA margin of 4.5% of Gross Bookings (an all-time high) and Income from Operations of $1.1 billion. This is quite a contrast to the billions in losses incurred just a few years prior.
The competitive landscape has stabilised into a rational oligopoly in most regions. In the US, Lyft acts as a price-taker, lacking the scale to initiate aggressive discounting wars. In U.S. Delivery, while DoorDash leads in volume, Uber leverages its cross-platform membership, Uber One, to drive retention. With 189 million Monthly Active Platform Consumers (MAPCs) , Uber’s ability to cross-sell a rider into a delivery customer (and vice versa) provides a structural CAC advantage that pure-play competitors cannot replicate. More on this, as well, in our deep dive. For now, let’s dive into the numbers.

3. Discounted Cash Flow (DCF): Assumptions & Methodology
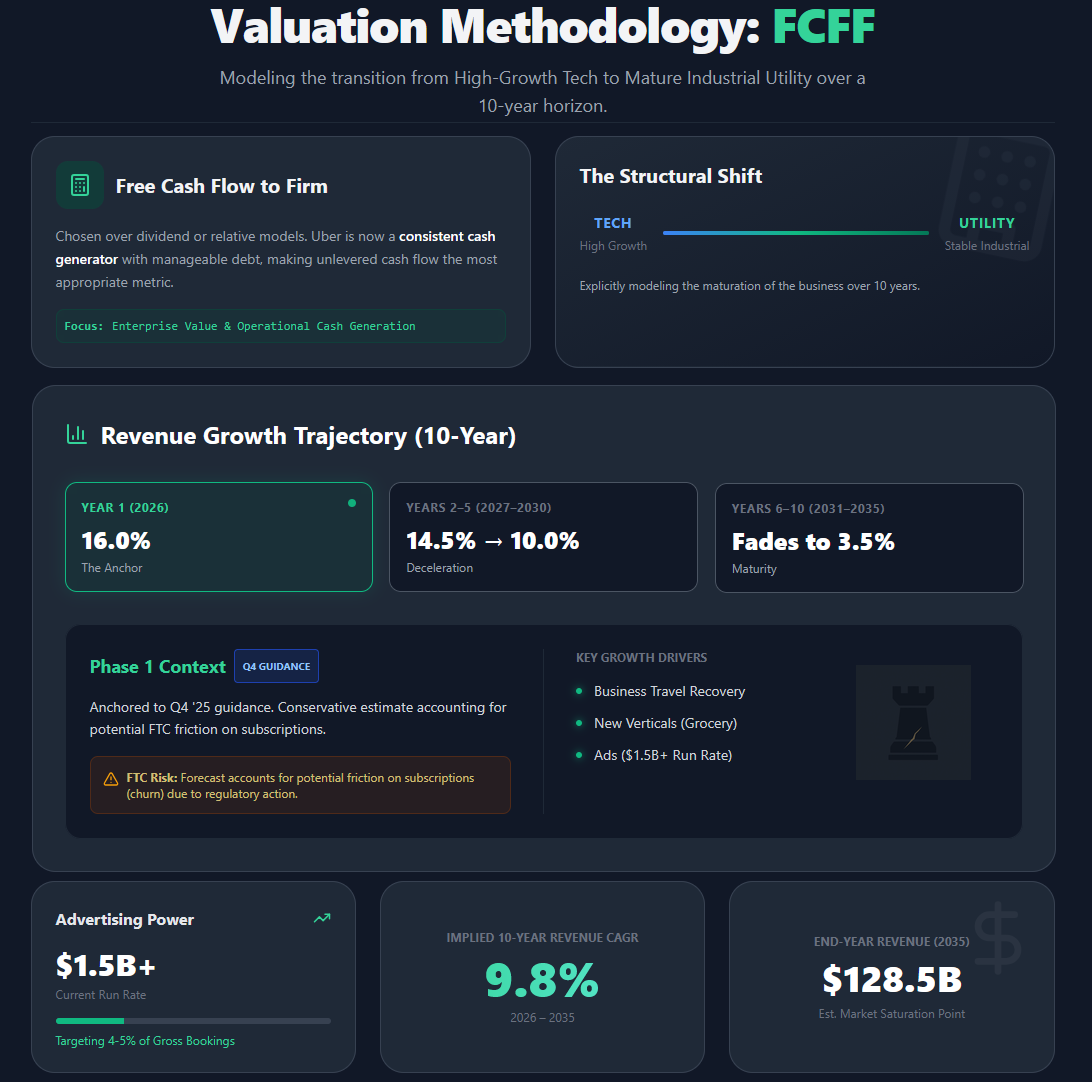
The valuation framework we used here is a Free Cash Flow to the Firm (FCFF) model. This approach is chosen over dividend discount or relative valuation models because Uber is now a consistent cash generator with a capital structure that includes manageable debt, making the unlevered cash flow view the most appropriate for assessing enterprise value. We explicitly model the transition from a high-growth technology company to a mature industrial utility over a 10-year horizon.
3.1 Revenue Forecast (Years 1–10)
The revenue forecast is constructed by modeling Gross Bookings growth and the Take Rate (Revenue as a % of Gross Bookings) separately. This granularity is required because “Revenue” is an accounting output, whereas “Gross Bookings” represents the actual economic activity on the platform.
Year 1 (2026) Growth: 16.0%
We anchor our 2026 forecast by referencing the company’s Q4 2025 guidance, which projects Gross Bookings growth of 17–21% YoY (constant currency). We adopt a conservative stance, assuming ~16% revenue growth in 2026, broadly consistent with the low end of that Gross Bookings growth range after allowing for take-rate variability. This conservatism accounts for potential friction from the FTC’s regulatory action on subscriptions, which may temporarily elevate churn in the high-value Uber One cohort.
We assume continued recovery in business travel, expansion of the “New Verticals” (Grocery/Retail), and the compounding effect of the advertising business, which is now operating at a run rate exceeding $1.5 billion.
Years 2–5 (2027–2030): Decelerating from 14.5% to 10.0%
In this phase, we assume a gradual deceleration as the law of large numbers takes effect. By 2030, Uber would be approaching $100 billion in annual revenue. Growth in this period is supported by the maturation of international markets (LatAm, APAC) and the deepening penetration of the advertising platform, which allows Uber to increase its effective take rate without raising consumer prices.
We assume that in this period, advertising is a high-margin revenue stream that structurally lifts the take rate. We assume advertising revenue grows to represent ~4-5% of Gross Bookings by Year 5.
Years 6–10 (2031–2035): Fades to 3.5%
In this terminal phase, the growth rate fades linearly to 3.5% in the terminal year (2035). This rate is slightly above long-term nominal GDP forecasts (typically 2-3%), reflecting Uber’s pricing power as a utility and continued population growth in urban centers. It assumes the rideshare market has reached saturation in developed nations.
Our assumed implied 10-Year Revenue CAGR is ~9.8%, End-Year Revenue (2035) is ~$128.5 Billion and all figures are modelled in USD.
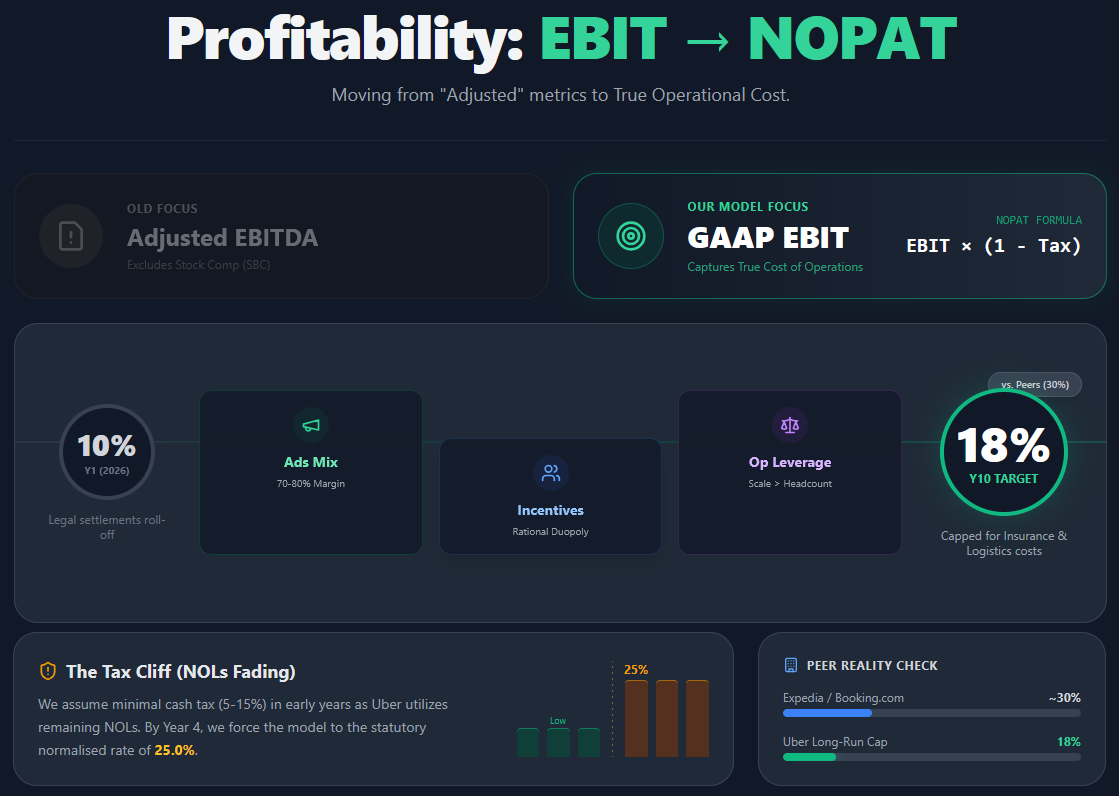
3.2 Profitability (EBIT → NOPAT)
The transition from Adjusted EBITDA to GAAP Operating Income (EBIT) is critical in our analysis. Adjusted EBITDA excludes Stock-Based Compensation (SBC), which is a real expense diluting shareholders. Our model uses GAAP EBIT to ensure a true cost of operations is captured.
Start EBIT Margin: 10.0%
Current LTM reported Operating Margin is approximately 8.3%. We model a step-up to 10.0% in Year 1 (2026) driven by the roll-off of one-time legal settlements and continued operating leverage on fixed R&D and G&A costs.
We assume “Cost of Revenue” (insurance, payments) scales linearly with volume, but G&A expenses decline as a percentage of revenue.
Long-Run Margin Path: Expands to 18.0% by Year 10
The expansion to 18% EBIT margin is driven by three factors:
Advertising mix shift where advertising revenue carries 70-80% margins, accretionary to the group.
Rationalised incentives - as the duopoly cements, driver and rider incentives (contra-revenue) decrease.
Operating Leverage - the platform nature allows revenue to scale faster than headcount.
Mature digital marketplaces (e.g., Booking.com, Expedia) often achieve margins of 25-30%. We cap Uber at 18% to account for the structurally higher costs of insurance and the physical nature of the logistics network.
Tax Rate: 25.0%
Uber currently benefits from significant Net Operating Losses (NOLs) and valuation allowance releases, resulting in a negative or near-zero cash tax rate (e.g., the $4.9 billion benefit in Q3 2025).
We assume Uber pays a minimal cash tax rate (5-15%) for Years 1-3 as it utilises remaining NOLs. By Year 4 (2029), we force the tax rate to the statutory normalised rate of 25.0% (blended US federal/state and international). This creates a “tax cliff” in the FCF forecast that provides a realistic drag on value while still remaining comfortably conservative.
NOPAT Calculation
NOPAT = EBIT × (1 - Tax Rate)
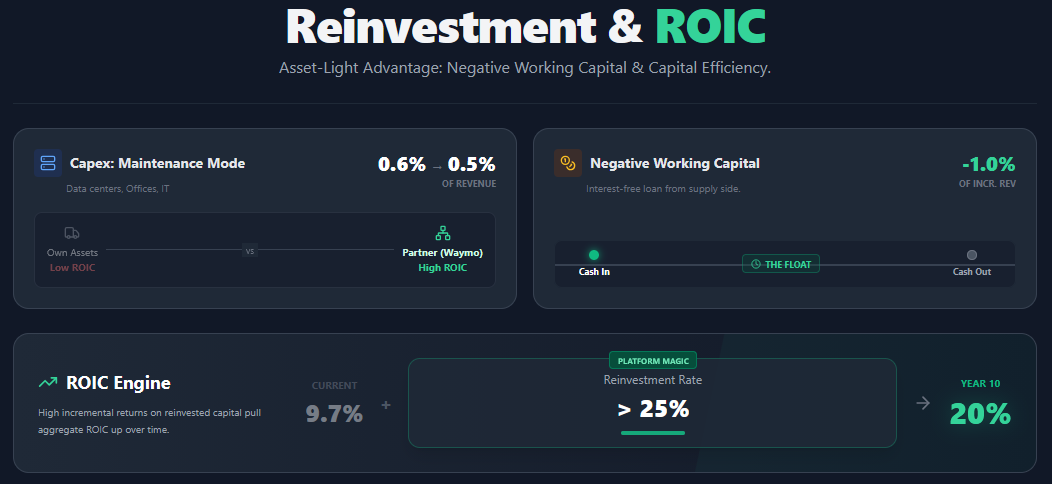
3.3 Reinvestment & ROIC
Uber operates an asset-light model where the capital heavy lifting (the vehicles) is done by the supply side (drivers/fleets). However, “asset-light” does not really mean “zero investment.”
Capex
We model Capex at 0.6% of revenue initially, converging to 0.5% in the terminal year. This spend is primarily for data centers, office facilities, and internal IT infrastructure.
Even in an autonomous future, we assume Uber maintains a “hybrid network” approach where it partners with fleet operators (like Waymo) rather than owning the metal assets on its balance sheet. This preserves the ROIC profile.
Net Working Capital (NWC)
Uber collects cash from riders instantly but pays drivers/merchants on a delayed cycle (weekly or daily). This creates a negative working capital cycle where growth generates cash.
We model ΔNWC as -1.0% of incremental revenue, fading to 0% in perpetuity. This “float” is a distinct advantage of the marketplace model, acting as an interest-free loan from the supply side to fund growth.
ROIC (Return on Invested Capital)
We use the number ~9.7% as the current ROIC. As far as a forecast goes, we model incremental ROIC on reinvested capital to remain high (>25%) due to the platform nature of the business. This pulls the aggregate ROIC up to 18-20% by Year 10.
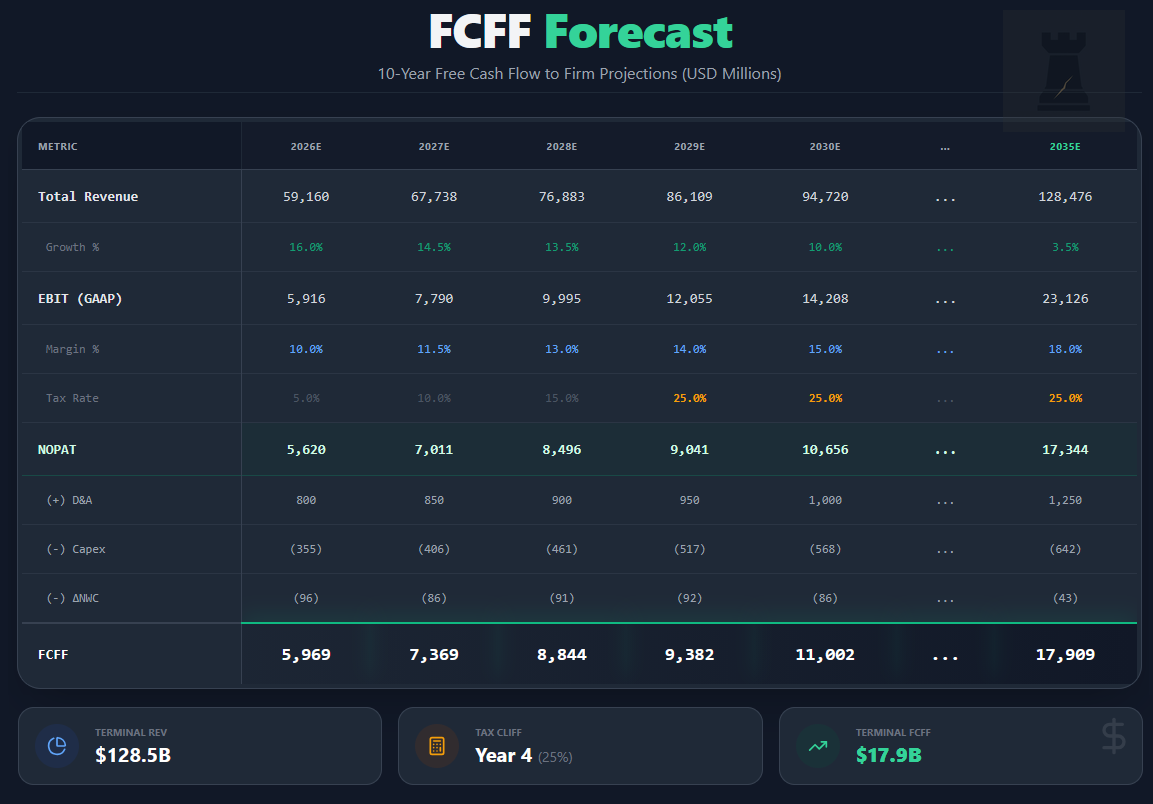
3.4 Free Cash Flow to the Firm (FCFF)
The formula used is:
FCFF = NOPAT + D&A - Capex - ΔNWC
3.5 Discount Rate (WACC)
The Weighted Average Cost of Capital (WACC) serves as the hurdle rate for our cash flows. We construct this using market-based inputs current as of December 17, 2025.
Risk-Free Rate (Rf): 4.18% (yield on the US 10-Year Treasury Bond as of Dec 16, 2025.)
Equity Risk Premium (ERP): 3.79% (Damodaran’s implied ERP estimate for December 1, 2025)
Beta (β): 1.19. (5-Year Weekly Regression against the S&P 500. This beta reflects the stock’s historical volatility relative to the market. We have chosen not to unlever/re-lever significantly as the current capital structure is relatively standard for its maturity.)
Cost of Equity (Ke):
Ke = Rf + β x ERP
Ke = 4.18% + 1.19 x 3.79%
Ke = 8.69%
Pre-Tax Cost of Debt (Kd): 5.00% (based on the Yield to Maturity (YTM) of Uber’s outstanding 2035 bonds, which trade at a yield of approx 4.93%. We round to 5.00% to include issuance friction)
Tax Shield: 21% (marginal corporate tax rate).
After-Tax Cost of Debt:
Kd (1 - t) = 5.00% x (1 - 0.21) = 3.95%
Capital Structure: We assume ~$170 Billion (at share price of $81.86), total debt at ~$10.6 Billion (long-term) + lease liabilities, which gets us to weights: ~90% Equity / ~10% Debt.
WACC Computation
WACC = (0.90 x 8.69%) + (0.10 x 3.95%) = 7.82% + 0.40% = 8.22%
Our final used WACC = 8.2% and we test the valuation sensitivity at ±100 bps (7.2% and 9.2%).
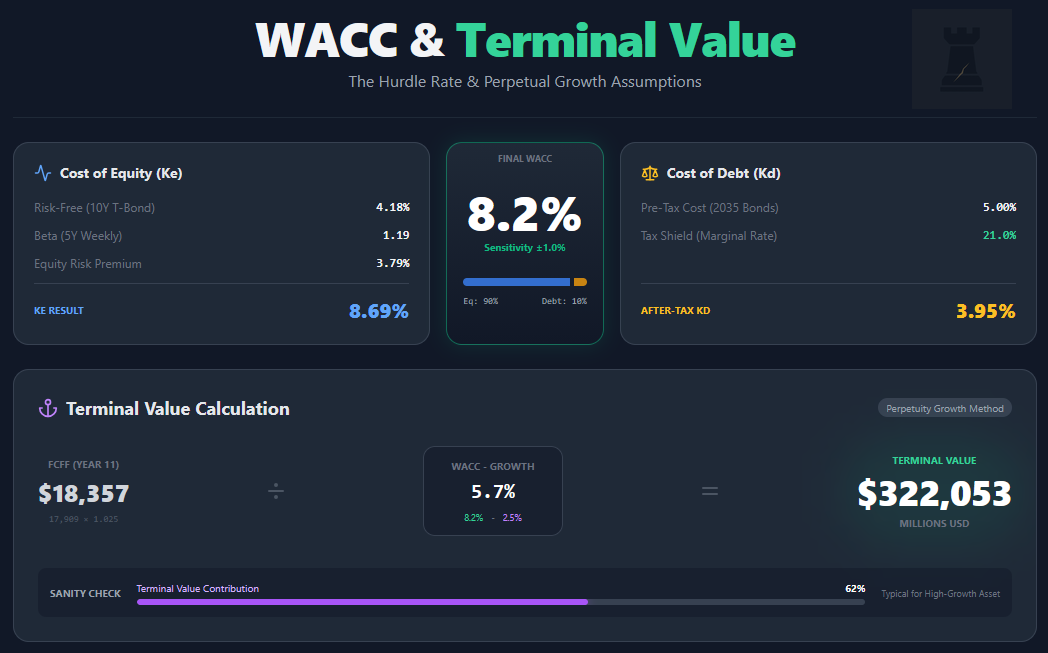
3.6 Terminal Value
We calculate the Terminal Value (TV) using the Perpetuity Growth Method, assuming the business continues indefinitely as a going concern.
Terminal Growth Rate (g): 2.5%
This is set conservatively below the long-term nominal GDP growth expectation of 3-4%. It reflects the view that while Uber will have pricing power, its volume growth will eventually track population and economic expansion.
Formula used: TV = FCFF(n+1) / WACC - g
The calculation is as follows:
FCFF(Y11) = FCFF(Y10) x (1 + g) = 17,909 x 1.025 = 18,357
then
TV = 18,357 / (0.082 - 0.025) = 18,357 / 0.057 = $322,053 million
Sanity Check: The Terminal Value represents approximately 62% of the total Enterprise Value, which is typical for a high-duration asset with significant growth remaining in the explicit forecast period.
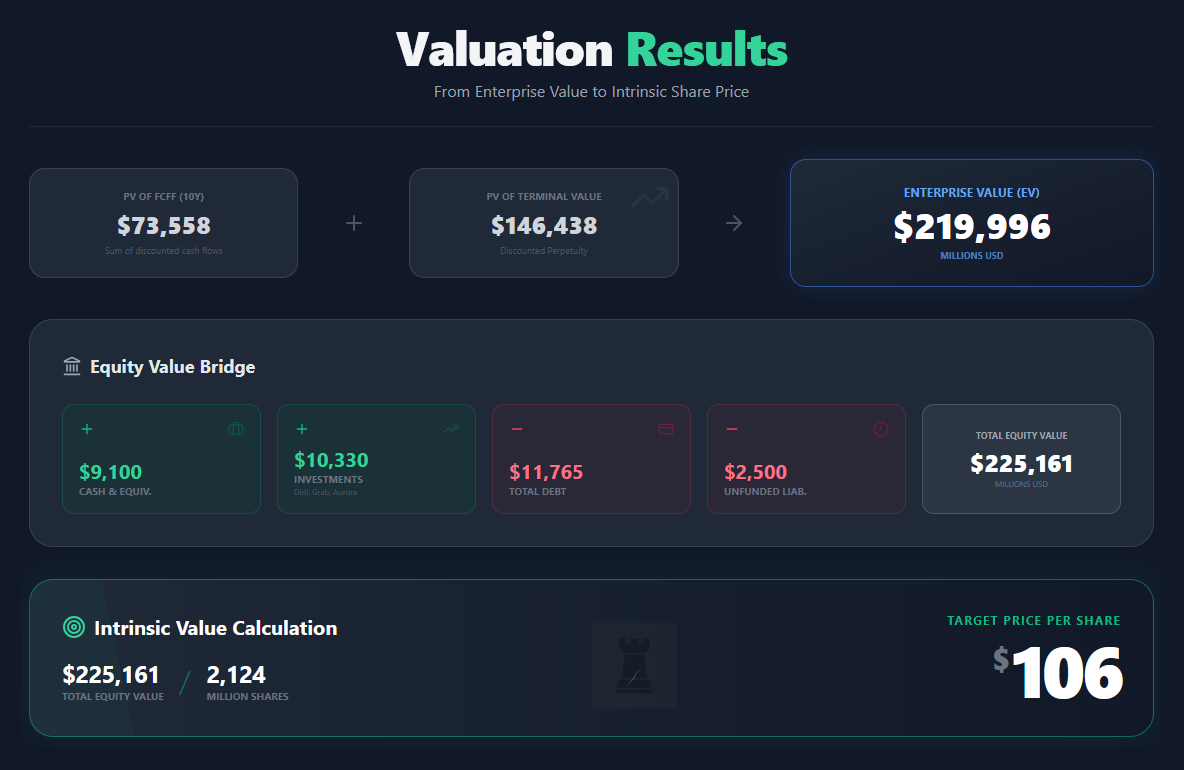
4. Results
We sum the Present Value (PV) of the explicit forecast period cash flows and the PV of the Terminal Value to arrive at the Enterprise Value.
PV of FCFF (Years 1–10): Using the 8.2% WACC discount factors:
Sum PV(FCFF) = $73,558 Million
then
PV of Terminal Value = $146,438 million
Enterprise Value (EV): 146,533 + 73,558 = $219,996 million
Equity Value Bridge:
Enterprise Value: $219,996M
(+) Cash & Cash Equivalents: $9,100 (Q3 2025 Unrestricted Cash)
(+) Equity Investments: $10,330 (Book value of stakes in Didi, Grab, Aurora, etc.)
(-) Total Debt: $11,765
(-) Unfunded Liabilities: $2,500 (model assumption)
Total Equity Value: $225,161 Million
Intrinsic Value per Share
Diluted Shares Outstanding: 2,124 Million (Weighted Average Q3 2025), then:
Value per share: 225,161 / 2,124 = $106
Scenarios
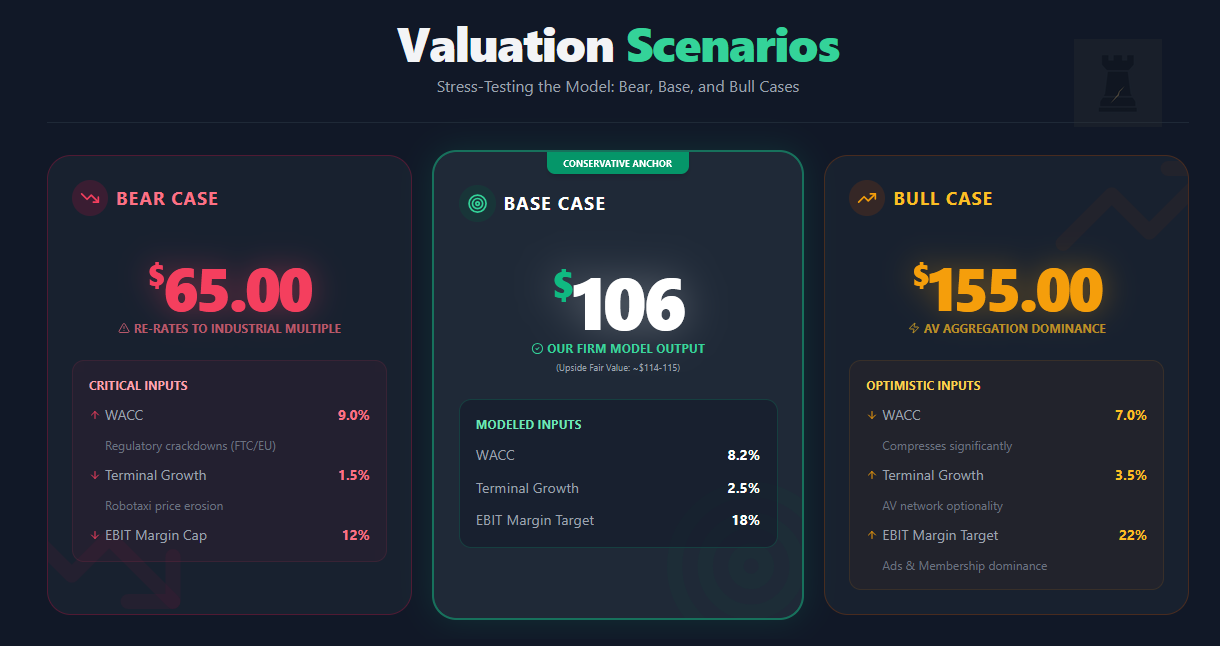
Bear Case: $65.00
Inputs: WACC rises to 9.0% due to regulatory crackdowns (FTC fines, EU reclassification). Terminal growth falls to 1.5% as Robotaxis (Tesla/Waymo) erode pricing power. EBIT margins cap at 12%.
Outcome: The stock re-rates to a low-growth industrial multiple.
Base Case: $106
As modelled above (WACC 8.2%, Growth 2.5%, Margin 18%). Note that our strict base-case model output is $106/share. Since our inputs are (always) rather conservative, we’d like to also present an upside fair value of ~$114–$115/share under a slightly lower cost of capital (e.g., WACC ~7.8% from deleveraging / lower beta) and/or a modestly higher terminal growth assumption (e.g., g ~3.0% vs 2.5%), which implies a slight premium for the optionality of the AV network. We are firm on our conservative assumptions, though, and thus the base case remains at $106.
Bull Case: $155.00
Inputs: WACC compresses to 7.0%. Uber dominates the AV aggregation layer. Margins expand to 22% driven by Advertising and Membership dominance. Terminal growth 3.5%.
Reverse DCF: Market-Implied Expectations
At the current price of $79.31, the market is clearly not underwriting our base case. Converting price into operating value using our own bridge items implies an enterprise value of roughly $163B, versus about $220B in our base case. That’s a ~26% discount to our modeled operating value. If we hold our revenue, capex and tax assumptions constant and solve the DCF backwards, that discount is broadly consistent with a market-implied WACC around ~10% (vs. our 8.2%) or, equivalently, a steady-state profitability ceiling closer to ~13–14% EBIT margin (vs. our 18%) if the discount rate stays near our base. In other words, the market is effectively assuming Uber never fully escapes the structural drags (insurance, incentives, and regulatory friction) and therefore deserves either a meaningfully higher risk discount or a permanently lower margin profile. This, in our view, is the core mispricing. The market is pricing Uber like a “broken growth” platform rather than a maturing cash-compounding liquidity utility.
5. Conclusion: Margin of Safety & Final Verdict
Margin of Safety = 1 – (Current Price / Intrinsic Value)
Margin of Safety = 1 – ($79.31 / $106) = 25.18%, rounded to 25%
This ~25.0% margin of safety places the stock in the undervalued category based on our defined scale (15% ≤ MoS < 40%).
Final verdict: Undervalued (Intrinsic Value = $106)
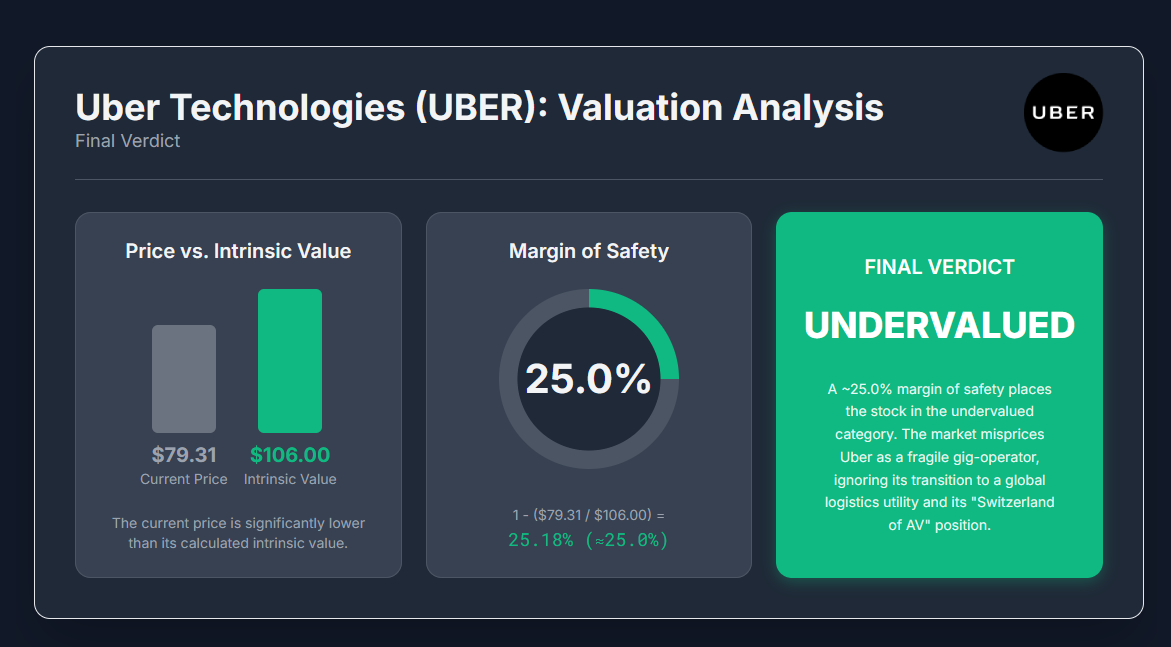
The market is currently mispricing Uber Technologies as a fragile gig-economy operator rather than a burgeoning global logistics utility. The primary source of this mispricing is a “fear discount” related to the Robotaxi Death Star narrative, which is a belief that autonomous vehicle fleets from Tesla or Waymo will render Uber’s driver network obsolete. This narrative ignores the critical role of demand aggregation. Autonomous vehicles require high utilisation to be profitable. Uber controls the demand (3.5 billion trips per quarter) necessary to provide that utilisation. By partnering with Waymo and others, Uber positions itself as the essential “Switzerland of AV,” (hi, Adobe) monetising autonomous miles without bearing the massive capital risk of fleet ownership.
Furthermore, the “regulatory overhang” from the FTC lawsuit regarding subscription cancellations is a headline risk that creates a temporary depression in the multiple, but does not fundamentally break the network effect. With a margin of safety approaching 25% and a clear path to $10B+ in annual Free Cash Flow, Uber offers asymmetric upside for investors willing to look past the “hated” headlines.
Disclosure
The author of this report does hold a position in the security of Uber Technologies, Inc.(UBER) with average price of $79.23 per share. UBER is also part of our Hated Moats Portfolio with avg price of $79.01 per share. This report is for informational purposes only and does not constitute investment advice or a recommendation to buy or sell any security.
Great post mate! Really like the DCF Friday concept!
It's a great way for me to get a feeling for valuations on companies I'm not very familiar with.
Keep it going!
Great post, HM! Thanks for sharing.