
Wix.com: DCF Valuation
Is Wix being priced for a Chegg outcome, just as it pivots to an AI creation OS and authorises a $2B buyback? - DCFriday #009

Date of Analysis: January 29-30, 2026
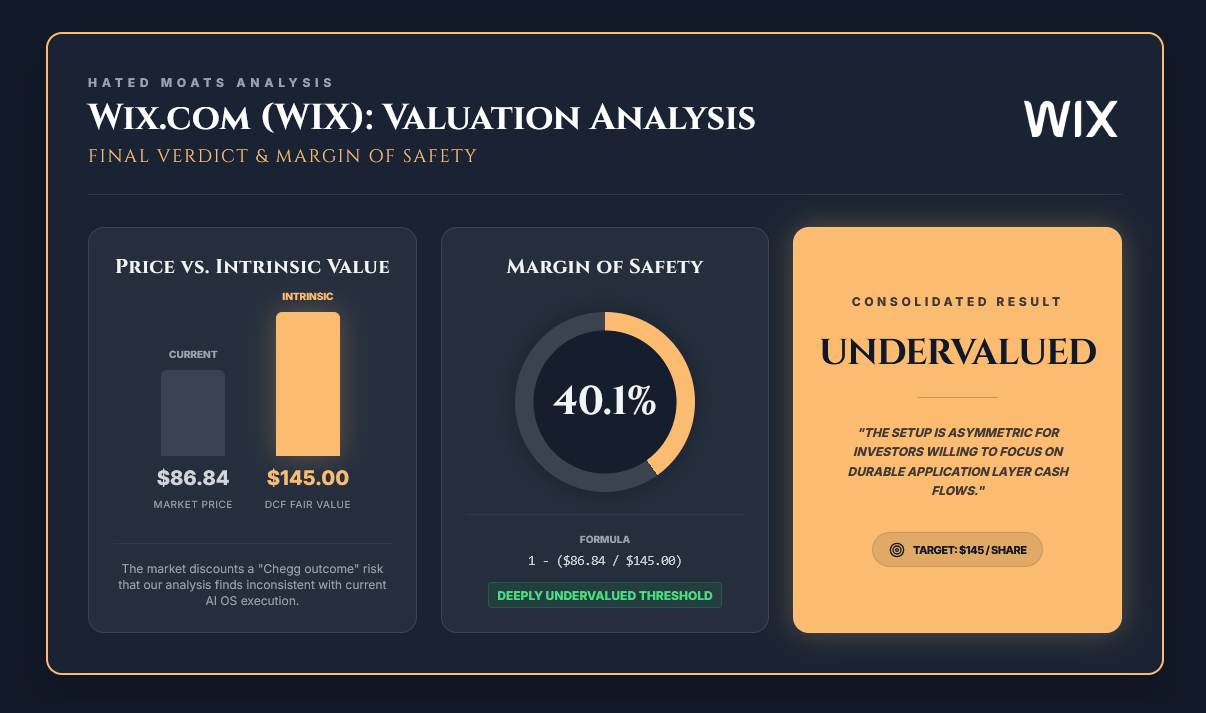
Verdict: Deeply Undervalued
Current Price Target (Base Case): $145
Price at the Time of Analysing: $86.84
1. Brief Overview
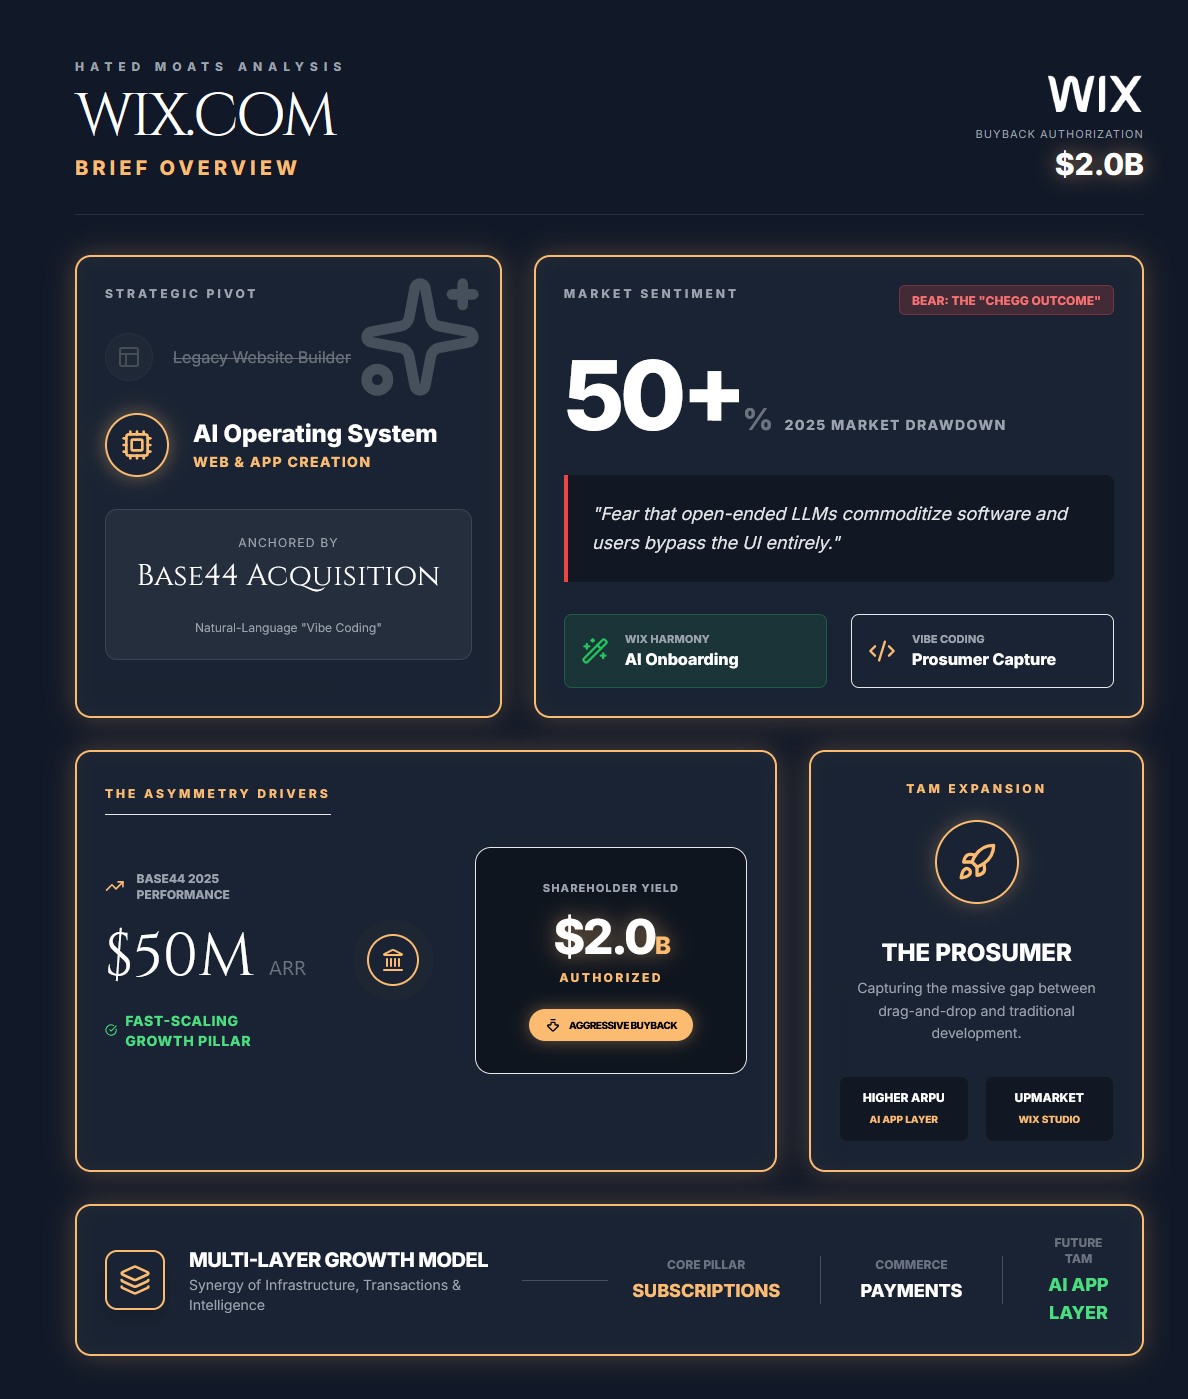
Wix.com Ltd. ( WIX 0.00%↑ ) enters 2026 at a genuine inflection point. The stock’s ~50% drawdown through 2025 reflects a single dominant fear. The “Chegg Outcome”, where open-ended LLMs commoditise incumbent software and users bypass the UI entirely. On that framing, a website builder becomes an anachronism, and the equity deserves a permanently lower multiple.
Our view is that this fear is reductive. Wix is'n’t positioning itself as “a website builder” anymore. The strategic pivot is toward becoming an AI operating system for web and app creation, anchored by the Base44 acquisition (natural-language full-stack “vibe coding”) and the launch of Wix Harmony (AI-assisted onboarding and creation). Base44 is the key chess move here. It captures a large, fast-growing “prosumer” cohort that is beyond drag-and-drop, yet not a traditional developer. In other words, Wix is attempting to sit exactly where the value migrates, i.e. between raw LLM capability and a production-grade, deployable web/app output that SMBs can actually run, monetise, and manage.
Two catalysts reinforce the asymmetry. First, Base44 exited 2025 with approximately $50M ARR run-rate per management and had user growth scaling rapidly, giving Wix a credible third pillar beyond subscriptions and payments. Second, the $2B buyback authorisation announced January 28, 2026 is unusually aggressive relative to Wix’s market cap. By all means, this is not a routine, maintenance repurchase. It reads as management’s own statement that the market is materially mispricing the future cash-generation capacity of the business, at exactly the moment when the narrative has turned most pessimistic.
With that framing, we model Wix as a maturing subscription platform that continues to compound, an expanding transaction layer (payments/commerce) that benefits from upmarket motion via Wix Studio, and now an AI application layer that can expand TAM and raise ARPU if execution is competent.
Let’s look at our DCF model…
2. Discounted Cash Flow (DCF): Assumptions & Methodology
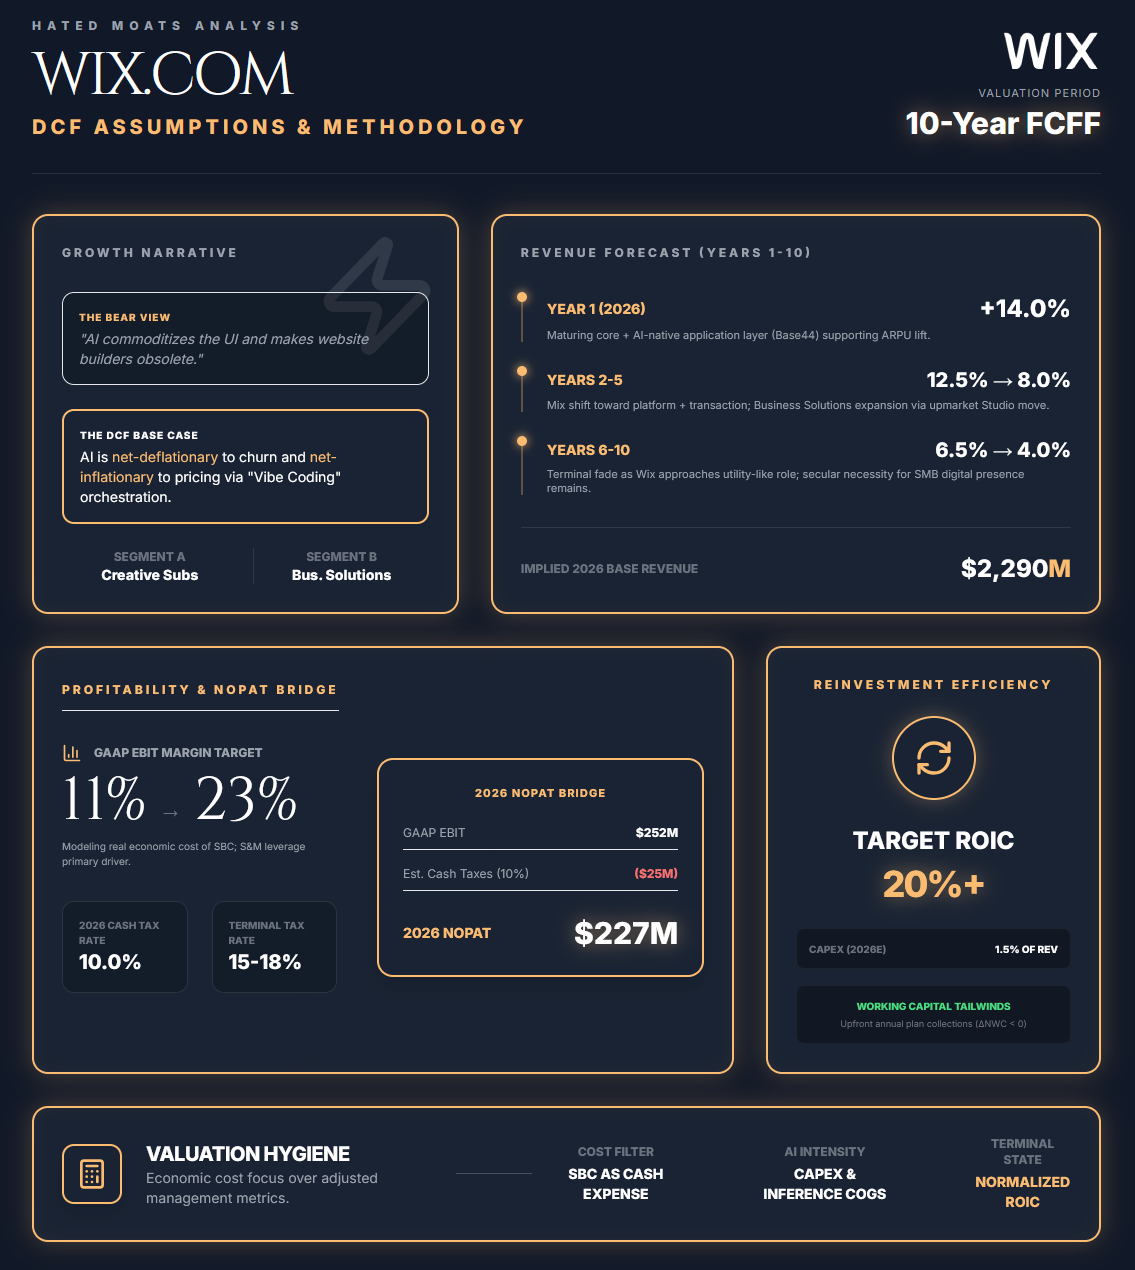
We value Wix using a 10-year Free Cash Flow to the Firm (FCFF) model.
2.1 Revenue Forecast (Years 1-10)
Our revenue set-up for Wix as of late January 2026 sits at a defining collision point between two narratives. One is maturity of the traditional SaaS website builder model and the other one being a nascent, potentially explosive upside of generative AI orchestration (“vibe coding”). The bear narrative is that AI makes the UI obsolete. The base narrative in this model is basically the opposite. AI becomes net-deflationary to churn and net-inflationary to pricing, because it improves onboarding, reduces time-to-value, and creates higher willingness-to-pay for more complex outputs.
We forecast revenue using a bottom-up segmentation logic with Creative Subscriptions (recurring SaaS fees) and Business Solutions (transactional/consumption-based revenue), with an explicit growth vector for the AI application layer integrated via Base44.
Year 1 (2026) Growth: 14.0%
Our revenue set-up for Wix as of late January 2026 reflects a collision between a maturing core website-builder SaaS model and incremental upside from an AI-native application layer (including Base44). The bear narrative is that AI commoditises the UI and pressures pricing. The base case here is the opposite, as we mentioned above.
We forecast revenue using Wix’s reported buckets, i.e. Creative Subscriptions (recurring, recognised ratably, driven by ARR/bookings with a recognition-timing bridge) and Business Solutions (transactional/consumption-based, driven by attach and activity). AI/Base44 is modeled as an explicit driver within these levers, not a separate segment.
Years 2-5 (2027-2030): Decelerating from 12.5% to 8.0%
We model revenue growth decelerating from the mid-teens into the high single digits as scale increases, with a base-case path of 12.5% (2027E), 11.0% (2028E), 9.5% (2029E), and 8.0% (2030E). The important point is mix shift, not just the headline growth rate. We assume Business Solutions expands as a share of revenue as Wix moves upmarket with Studio and drives higher attach/volume per merchant, while Base44 and broader AI features support better retention and ARPU. The model thus evolves from “subscription-only” toward “platform AND transaction,” which typically increases revenue durability even as growth normalises.
Years 6-10 (2031-2035): Fading from 6.5% to 4%
Growth fades to 4% in the terminal year as Wix approaches a mature, utility-like role in the web ecosystem. We assume the core DIY web-creation market is increasingly penetrated in developed regions, but secular necessity remains intact. The model assumes Wix maintains pricing power roughly around inflation with modest incremental volume growth, while mix shift toward Business Solutions and AI-enabled monetisation partially offsets core maturity. For Years 6–-0, we fade revenue growth from 6.5% (2031E) to 4.0% (2035E) as attach rates, take rates, and cohort expansion normalise at scale.
2.2 Profitability (EBITDA → NOPAT)
We model GAAP EBIT rather than adjusted EBITDA, because institutional-grade valuation should treat stock-based compensation as a real economic cost (expense and dilution/buyback offset). In other words, we do not rely on ‘management FCF’ definitions that can structurally overstate sustainable per-share earning power.
The profitability profile is shaped by a trade-off unique to the AI era. AI adds a new cost driver in inference compute, which is not truly zero-marginal-cost. In the near term, this can compress GAAP gross margins while the company subsidises adoption and builds habit formation. For this reason, we model a mild near-term gross margin dip, then recovery as pricing tiers catch up and model/hardware efficiency improves.
At the operating line, the main lever remains sales and marketing leverage. As AI-assisted onboarding and automation reduce friction, Wix should need less aggressive paid acquisition for lower-quality cohorts and less support intervention, allowing S&M as a percentage of revenue to step down over time. R&D remains structurally elevated relative to mature software peers given ongoing AI integration and Base44’s engineering intensity. We also model SBC declining gradually as a percentage of revenue as the company matures.
EBIT Margin: From 11.0% to 23.0%
We start 2026 at an 11.0% GAAP EBIT margin, reflecting continued profitability progress and assuming the company remains disciplined on operating costs despite the AI investment cycle. We then expand margins progressively toward 23.0% by 2035, driven by scale benefits, S&M leverage, and normalised AI unit economics. Note: To land at 11% GAAP EBIT, one of these must be true: SBC drops fast (as % of revenue), and/or non-GAAP operating margin expands further (while SBC stays flat-ish), and acquisition/one-time items normalise.
Tax Rate
On taxes, Wix has historically benefited from Israeli incentive structures and tax attributes, but global minimum tax frameworks are putting a higher floor under multinational effective tax rates. We model a cash effective tax rate that starts low in the near term and normalises over time: 10-12% in 2026-2028, stepping toward 15% by 2030, and converging to a normalised 15-18% cash tax rate in the terminal period (applied to terminal-year EBIT when computing terminal NOPAT/FCFF).
NOPAT Calculation
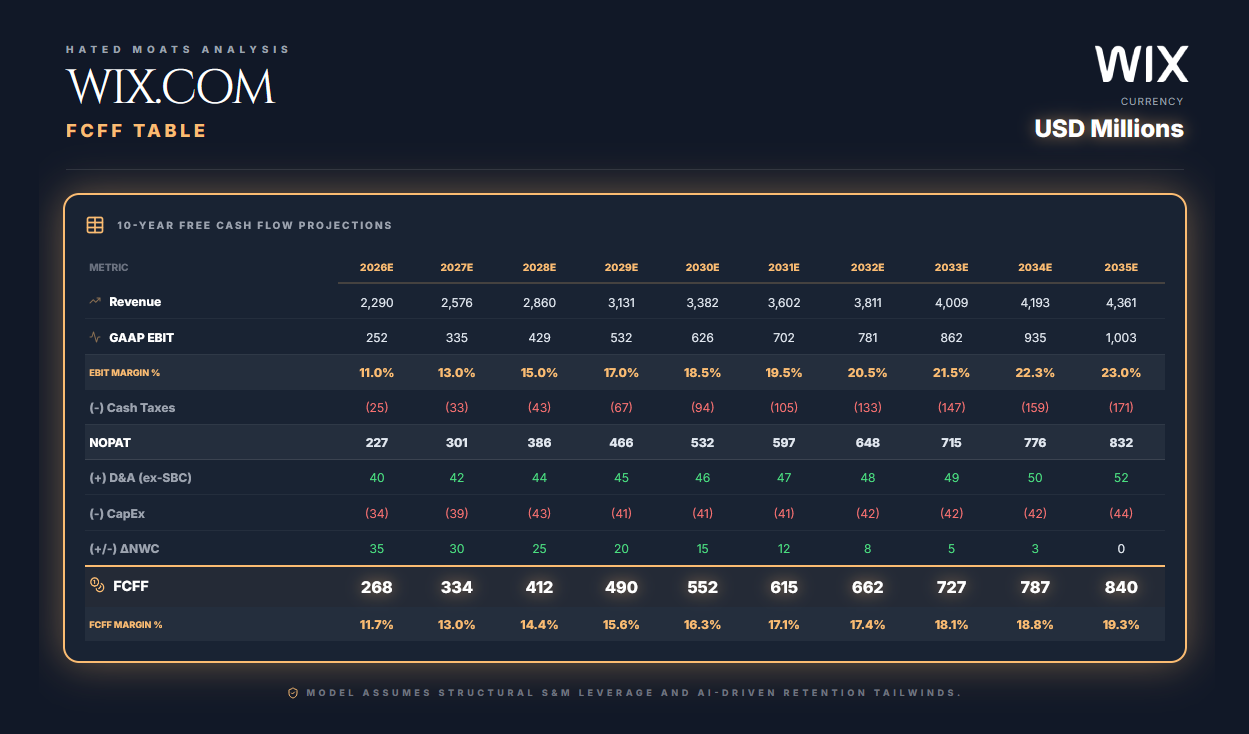
For 2026, our NOPAT bridge is as follows: Revenue of $2,290M at a 11.0% GAAP EBIT margin yields $251.9M EBIT (~$252M). Applying a 10% cash tax rate implies $25.2M taxes, resulting in $226.8M NOPAT (~$227M).
2.3 Reinvestment & ROIC
Wix can be described as asset-light, but AI shifts the form of reinvestment. There is still tangible Capex (including capitalised software), and there is also reinvestment-like spend via cloud capacity commitments. Importantly, most AI inference compute is an operating cost (typically in COGS/R&D), even when delivered via hyperscalers rather than owned hardware. Historically, Wix’s cash Capex (including capitalised software development, where applicable) has been low, so we model only a modest near-term step-up as AI-related development and infrastructure scale, followed by a return toward a maintenance profile.
We forecast Capex at 1.5% of revenue in 2026-2028, fading to 1.0% in the terminal period. For 2026, that implies Capex of $34.4M.
Working capital is structurally favourable. Wix often collects upfront on annual/multi-year plans, so growth can generate cash via deferred revenue. We model a modest working-capital inflow (ΔNWC < 0) that tapers toward neutral as growth slows, rather than assuming outsized deferred-revenue inflows persist indefinitely.
This combination of rising NOPAT and a relatively lean operating invested-capital base supports expanding ROIC. We compute ROIC on operating invested capital (including capitalised software and treating deferred revenue as a non-interest-bearing operating liability). Our model targets a sustainable ROIC of 20%+ over time, implying ongoing value creation as long as ROIC remains comfortably above the cost of capital.
2.4 Free Cash Flow to the Firm (FCFF)
We compute FCFF using the standard framework:
FCFF = NOPAT + D&A − Capex − ΔNWC
We add back Depreciation & Amortization (D&A) as a non-cash charge. We do not add back SBC (it is already expensed in EBIT/NOPAT by design), subtract Capex (PP&E purchases + capitalised internal-use software), and incorporate working capital changes (noting Wix’s model often makes ΔNWC a positive contributor). Importantly, our FCFF is not “management FCF”. We treat SBC as an operating expense embedded in EBIT/NOPAT and do not add it back in FCFF. Per-share valuation therefore assumes SBC is borne economically via dilution (or offset via buybacks), which is the conservative approach for intrinsic value per share (which is the way we roll :).
2.5 Discount Rate (WACC)
Given the volatility Wix experienced through 2025 and the market’s “AI risk premium,” we use a forward-looking WACC that explicitly prices execution uncertainty.
We estimate cost of equity via CAPM (Capital Asset Pricing Model):
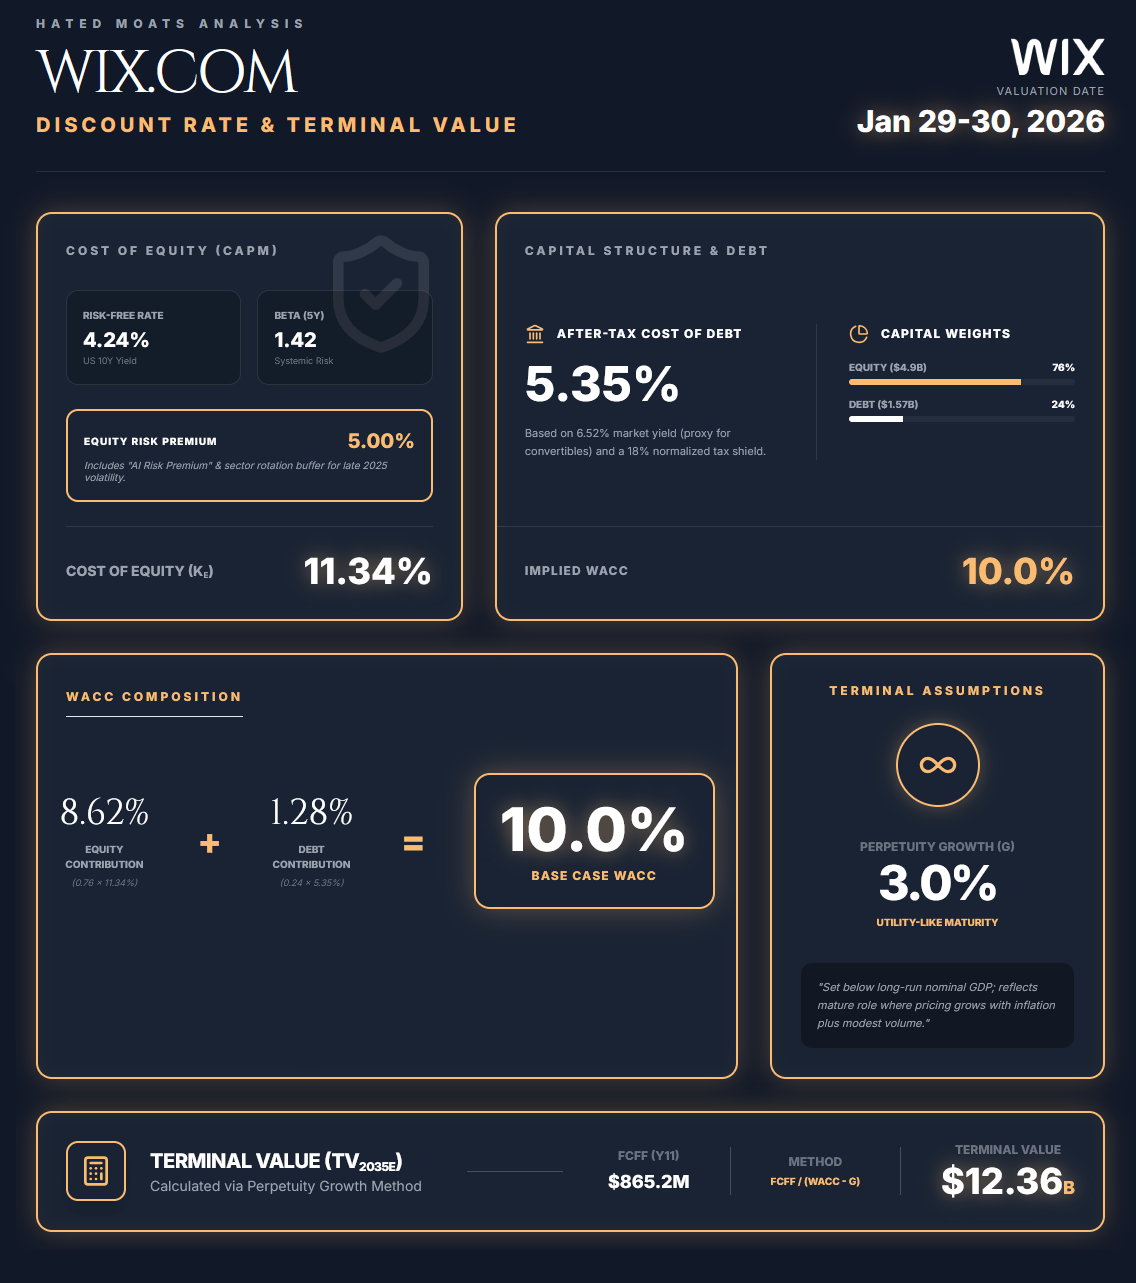
Risk-free rate (Rf): 4.24%, using the US 10Y on Jan 29, 2026.
Beta (β): 1.42 (5Y).
Equity risk premium (ERP): 5.00% (Professor Damodaran’s implied ERP for January 2025 was 4.33%. Considering the macroeconomic volatility and the sector rotation out of SaaS in late 2025/early 2026, we apply a slightly higher ERP of 5.00% to ensure a margin of safety.)
This yields Ke = 4.24% + 1.42 x 5.00% = 11.34%.
On debt, Wix’s capital structure includes significant convertibles, and the economic cost should be proxied using market yields rather than the 0% coupon. We use a 6.52% pre-tax cost of debt (Kd), consistent with prevailing US high-yield yields as of late January 2026. Applying a 18% normalised tax shield yields an after-tax cost of debt of 5.35%.
For weights, we use a market equity value of ~$4.9B (Jan 29, 2026) and total debt of $1.57B (latest reported quarter), implying 76% equity / 24% debt.
This produces a WACC of 9.94%, which we round to 10.0% for the base case.
WACC Calculation
WACC = (E/V x Ke) + (D/V x Kd x (1 − t))
WACC = (0.76 × 11.34%) + (0.24 × 5.35%) = 8.62% + 1.28% = 9.9%, rounded to:
WACC = 10.0%
2.6 Terminal Value
We calculate Terminal Value (TV) using the Perpetuity Growth Method, assuming Wix continues indefinitely as a going concern.
Terminal Growth Rate (g): 3.0%
This is set below long-run nominal GDP expectations and reflects a mature, utility-like role where pricing grows roughly with inflation plus modest net volume expansion, rather than sustained share gains.
Formula used:
TV = FCFF(n+1) / (WACC - g)
where
FCFF(n+1) = FCFF(n) × (1 + g)
The calculation is as follows:
FCFF(Y11) = FCFF(Y10) x (1 + g) = 840 x (1+0.03) = 865.2 million
then Terminal Value (perpetuity growth method):
TV(2035E) = FCFF(2036E) / (WACC − g) = 865.2 / (0.10 − 0.03) = 12,360 = $12.36B
3. Results
We sum the Present Value (PV) of the explicit forecast period cash flows and the PV of the Terminal Value to arrive at Enterprise Value (EV). All figures below are in $ millions.
PV of FCFF (Years 1–10)
Using a 10.0% WACC discount rate:
PV(FCFF) = discount Year 1 FCFF+discount Year 2 FCFF+...+discount Year 10 FCFF
PV(FCFF)= FCFF2026 / (1+WACC)^1 + FCFF2027 / (1+WACC)^2+ FCFF2028 / (1+WACC)^3+⋯+ FCFF2035 / (1+WACC)^10
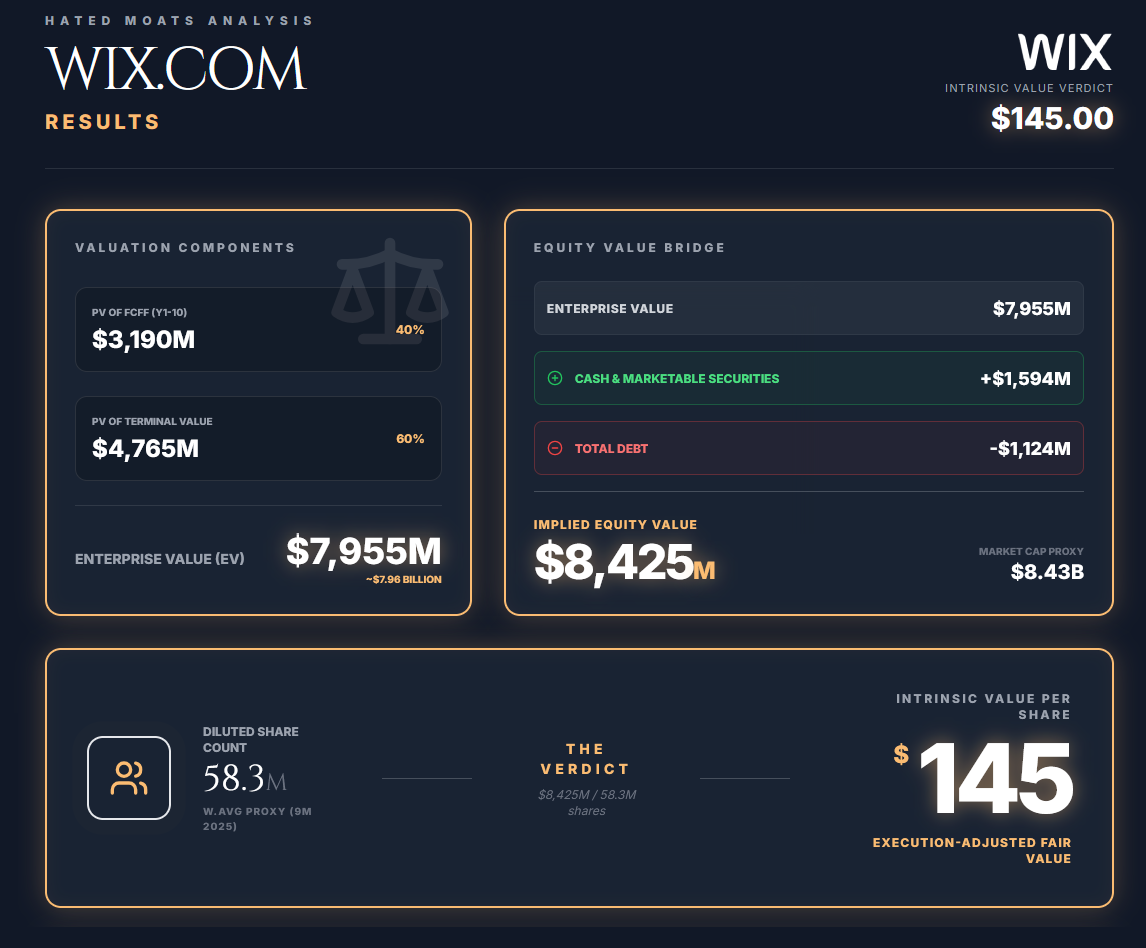
PV(FCFF) = $3,190M (sum of 2026E–2035E FCFF discounted at 10.0%)
PV of Terminal Value
We use the perpetuity-growth terminal value computed at the end of 2035:
TV (end of 2035) = $12,360M
PV(TV) = TV / (1 + WACC)^10
PV(TV) = $12,360M / ( 1 + 0.10)^10 = $4,765M
Enterprise Value (EV)
EV = PV(FCFF) + PV(TV)
EV = $3,190M + $4,765M = $7,955M (= $7.96B)
Equity Value Bridge:
We bridge from EV to equity value using the latest reported balance sheet cash and debt (as of Sep 30, 2025):
Enterprise Value: $7,955M
+ Cash & cash equivalents + restricted cash + short-term deposits + marketable securities: $1,593.9M (cash + short-term deposits + marketable securities)
− Debt: $1,124M (due to model structure, we exclude operating lease liabilities from debt)
Implied Equity Value:
Equity Value = $7,955M + $1,594M - $1,124M = $8,425M (= $8.43B)
Intrinsic Value per Share
Diluted weighted-average shares (9M 2025): 58.3M (proxy for diluted shares): 58.3 Million
Value per share = 8,425 / 58.3 = $144.5, rounded to $145 per share
4. Scenarios
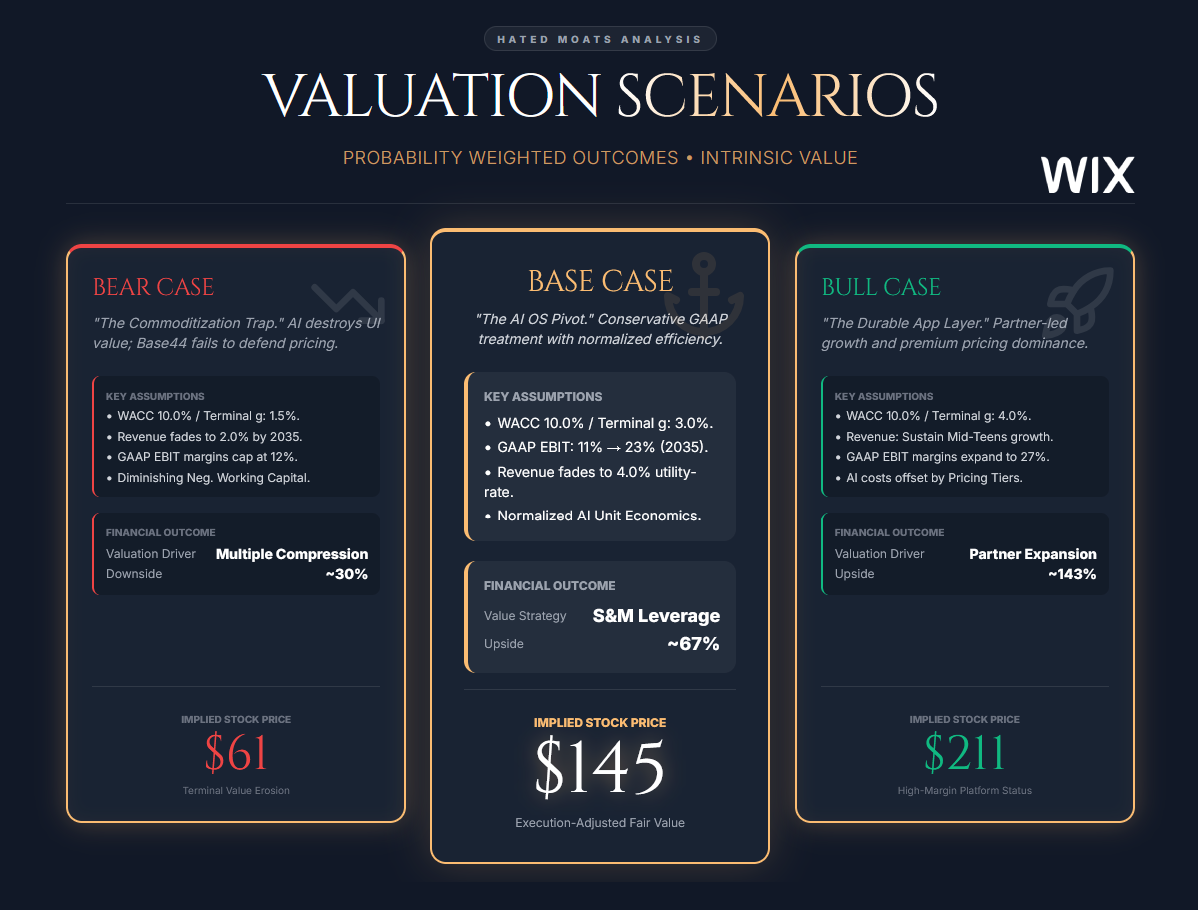
Bear Case: $61/share
Inputs:
WACC 10.0% (unchanged). Terminal growth 1.5%. Revenue growth decelerates quickly and fades to 2% by 2035 as AI commoditises the UI layer and Base44 fails to defend pricing. GAAP EBIT margins cap at 12% (limited leverage, weaker ARPU/mix). Reinvestment remains disciplined, but weaker growth reduces the “negative working capital” cash benefit (i.e., smaller deferred-revenue inflows over time).
Outcome:
Lower terminal growth and materially lower steady-state margins compress terminal value and reduce PV of explicit FCFF versus base. This implies 30% downside from the current price.
Base Case: $145/share
As modelled above (WACC 10.0%, terminal g = 3.0%, GAAP EBIT margin 11% in 2026 to 23% in 2035, revenue growth fading to 4% by 2035, normalised cash taxes and modest reinvestment). Note: this is our objective “base” output given conservative GAAP treatment of SBC and normalised AI unit economics.
This implies 67% upside to the current price.
Bull Case: $211/share
Inputs:
WACC 10.0% (unchanged). Terminal growth 4.0%. Base44 and AI-assisted creation becomes a durable application layer. Partner-led distribution and upmarket motion sustain stronger growth for longer (mid-teens near term fading to mid-single digits). GAAP EBIT margins expand to 27% by 2035 as S&M leverage improves and AI costs normalise through pricing tiers and efficiency.
Outcome:
Higher terminal cash flows (from better growth + higher steady-state margins) expand terminal value and lift intrinsic value materially versus base.
This implies upside 143% from the current price.
5. Conclusion: Margin of Safety & Final Verdict
Margin of Safety = 1 – (Current Price / Intrinsic Value)
Margin of Safety = 1 – ($86.84 / $145) = 40.1%
A 40% margin of safety places Wix in the undervalued bucket, on the verge of deeply undervalued, where the stock gets at the price of <$85 per share (i.e., currently >20% MoS for undervalued threshold & >40% for deeply undervalued). Put differently, the market price is discounting either a materially higher risk premium than our 10% WACC, structurally weaker long-run margins, and/or a post-2035 decline profile that is inconsistent with our base-case durability assumptions.
Final verdict: Undervalued (Intrinsic Value = $145)
Under our base case, Wix’s value proposition is not “a legacy website builder,” but an increasingly integrated subscription and transaction platform with AI-driven retention and ARPU tailwinds (Base44 as a significant upside optionality). Scenario framing reinforces the asymmetry: bear $61/share, base $145/share, bull $211/share. The current price ($86.84) implies a meaningfully more pessimistic steady-state than our normalised base.
6. Appendix: $2B buyback - how can it influence intrinsic value per share?
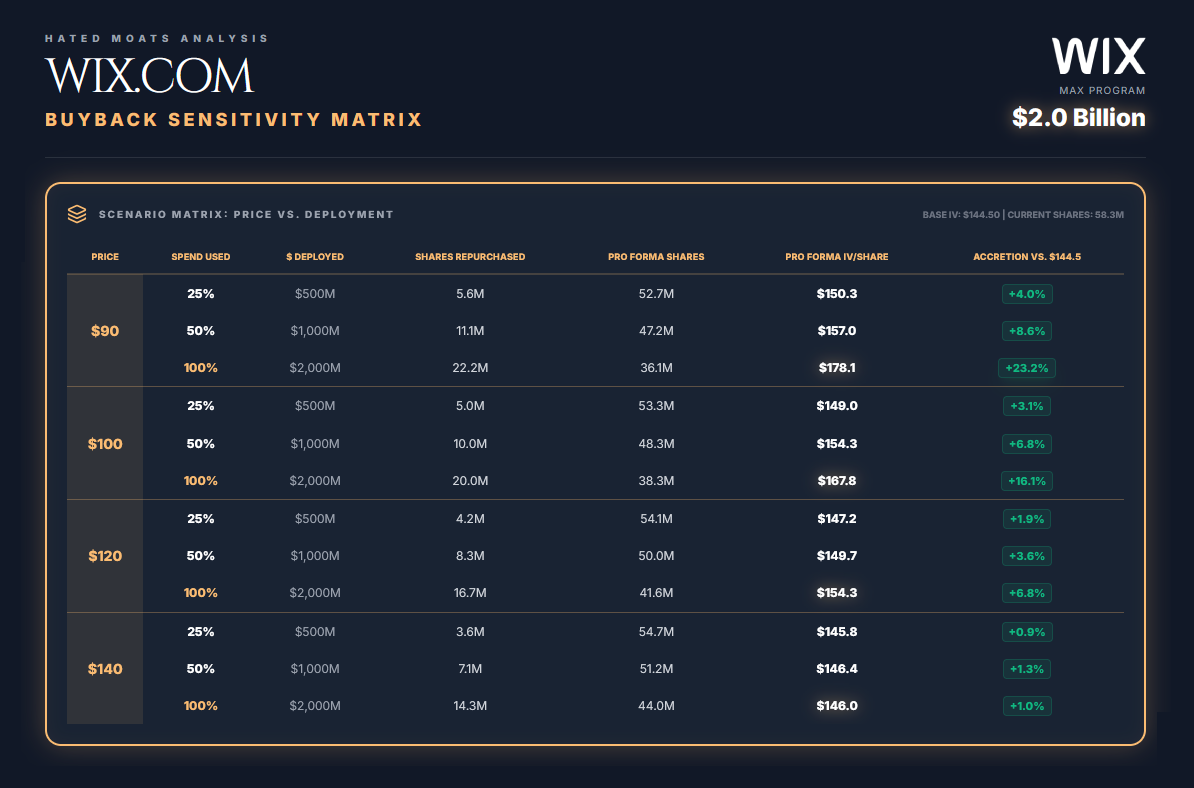
On January 28, 2026, Wix.com Ltd. announced its board authorised a $2B securities repurchase program for FY2026–FY2027, allowing repurchases of ordinary shares and/or convertible notes (timing and amounts are discretionary, not obligatory).
Key modeling point
In an EV/FCFF DCF, the buyback does not belong in FCFF. Repurchases are a capital return / financing decision, not an operating reinvestment line item. The primary impact is per-share. If the company repurchases stock below intrinsic value, it can increase intrinsic value per share by shrinking the share count.
What the $2B could do to intrinsic value per share (mechanical sensitivity, not a forecast)
Under our base case equity value of $8.43B and 58.3M diluted shares (intrinsic value = $145/share today), buybacks can be meaningfully accretive depending on execution price and how much of the authorisation is actually deployed.
If Wix deploys 25–50% of the authorisation at an average price of $90-$120, the mechanical uplift is already visible. Intrinsic value per share rises to roughly $147-$157 (vs. $145 today), depending on the exact price and dollars used.
If Wix deploys the full $2B at an average price of $100-$120, it would retire roughly 29-34% of shares and lift intrinsic value per share to roughly $154-$168.
If repurchases occur near intrinsic value (roughly $140-$145), the effect is close to neutral:. You are essentially swapping cash (worth intrinsic value) for shares priced near intrinsic value.
Note: Authorisation does not equal obligation. The company can repurchase less, later, or not at all. It can also prioritise convertible repurchases, which changes the per-share dynamics (reducing potential dilution and altering net debt), so the table above should be read as a shares-only accretion sensitivity, not a point forecast.
Disclosure
The author of this report does hold a position in the security of Wix.com Ltd in private portfolio since Jan 27, 2026 at $86.42 per share as well as a position in our Hated Moats Portfolio from the same date, with avg. price of $86.72. This report is for informational purposes only and does not constitute investment advice or a recommendation to buy or sell any security.