
Netflix: Deep Dive Analysis
The stock is down nearly 50% from its peak, yet revenue, margins and cash flow remain near record levels. Is Wall Street mistaking maturity for decline?
What Does the Company Do?
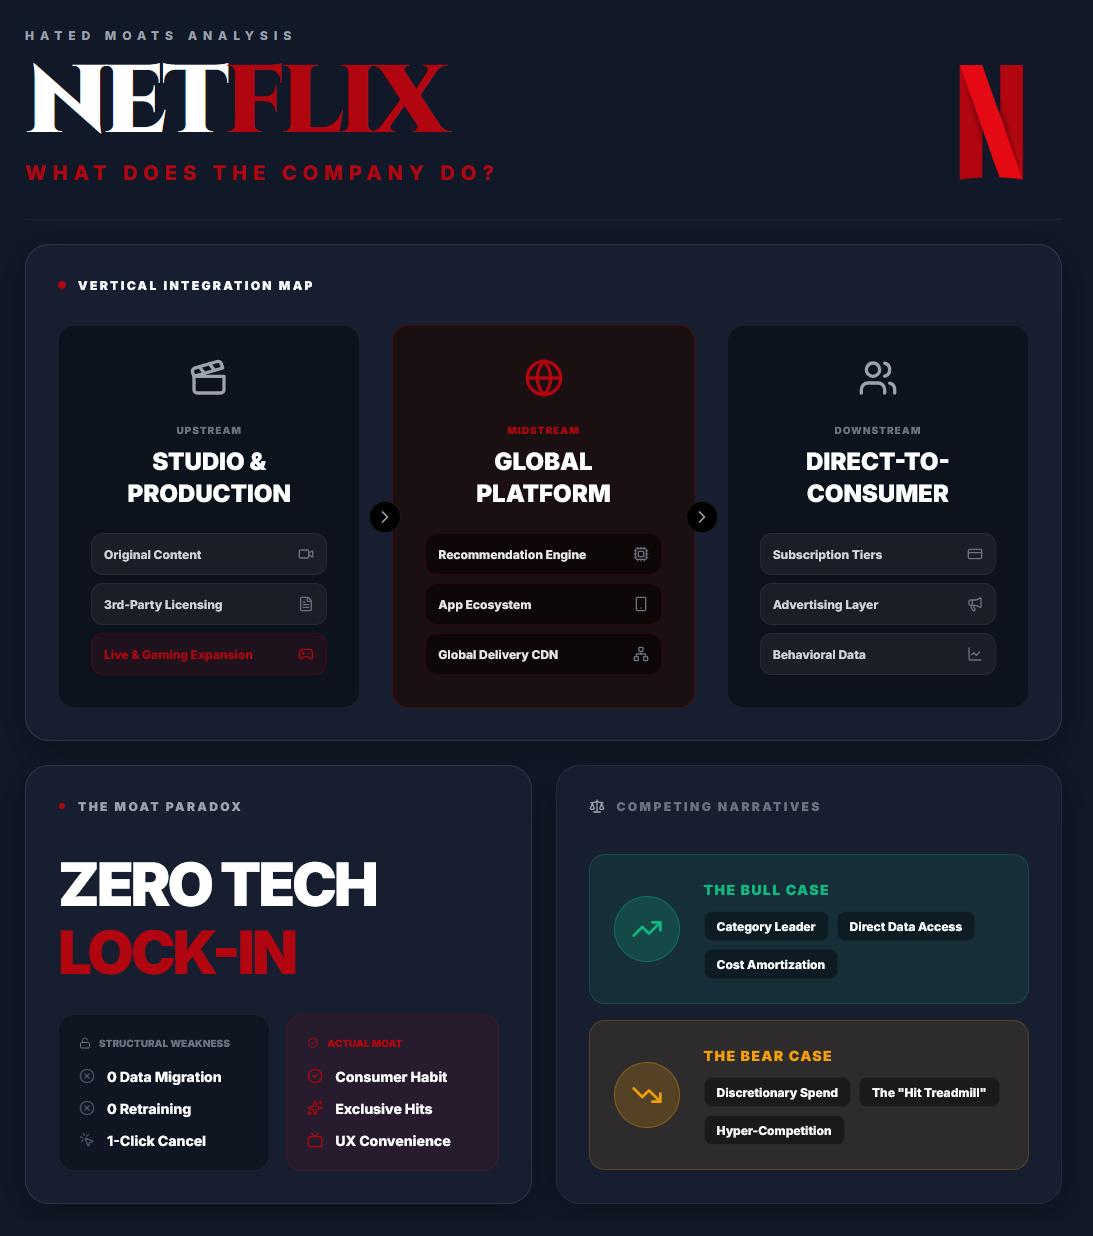
Netflix is a global entertainment company that delivers television series, films, live programming and games directly to consumers through an internet-based platform.
At first glance, Netflix appears relatively easy to understand. It’s the streaming company. But while analysing the business, we quickly learnt that this description is becoming too narrow. Netflix now combines several roles that were historically performed by separate companies. It produces original content like a studio, licenses programming from third parties, distributes it globally, recommends it through a personalised platform and increasingly monetises the same audience through both subscriptions and advertising.
In practical terms, Netflix gives households immediate access to a broad catalogue of entertainment without requiring them to follow broadcast schedules, purchase individual titles or maintain physical media. Members pay a recurring monthly fee and can watch across televisions, smartphones, tablets, computers and gaming consoles. Different plans allow Netflix to serve customers with different budgets, viewing preferences and tolerance for advertising.
In simple terms, customers are paying for entertainment variety, convenience and discovery.
Netflix occupies an attractive position within the entertainment value chain. Upstream, it works with studios, producers and rights holders to create or acquire content. Downstream, it delivers that content directly to consumers, controls the interface, sets subscription prices, collects payment and observes how audiences interact with its service. This gives Netflix valuable insight into what customers watch, where they stop and which programmes improve engagement and retention.
However, Netflix isn’t embedded in the same way as enterprise software or payment infrastructure. Cancelling a subscription doesn’t require data migration, retraining or operational redesign. Customers can leave within minutes and replace Netflix with Disney+, Amazon Prime Video, YouTube, gaming, social media or almost any other form of leisure.
Netflix therefore has very little technical lock-in. Its staying power comes instead from habit, convenience, exclusive content, brand recognition and personalisation. Profiles and watchlists improve the experience, but the real retention mechanism is simpler: Netflix must keep producing or licensing entertainment that people value.
The company built its original franchise around DVD rentals before launching streaming in 2007. It initially relied heavily on licensed content, but gradually became one of the world’s largest producers of original entertainment. More recently, it has expanded into live events, games, video podcasts and advertising. Netflix increasingly wants to become the first application consumers open for entertainment, rather than merely one of several places where they watch television.
Its revenue model remains relatively simple. Monthly membership fees still generate the overwhelming majority of revenue, while advertising is becoming an increasingly important second monetisation layer.
Ultimately, Netflix is caught between two competing narratives. The constructive view sees a category-leading global platform with a powerful brand, direct customer access and the ability to spread content spending across an enormous audience. The bearish view sees a discretionary service with limited switching costs, intense competition and a constant obligation to produce the next generation of hits.
That tension between a formidable business and a product whose place in the household must be continually earned is exactly what makes Netflix a compelling candidate for Hated Moats Analysis, especially after the recent drop.
Let’s dive in!
Why Is It Hated?
Netflix is currently “hated” because the market is questioning what it becomes next.
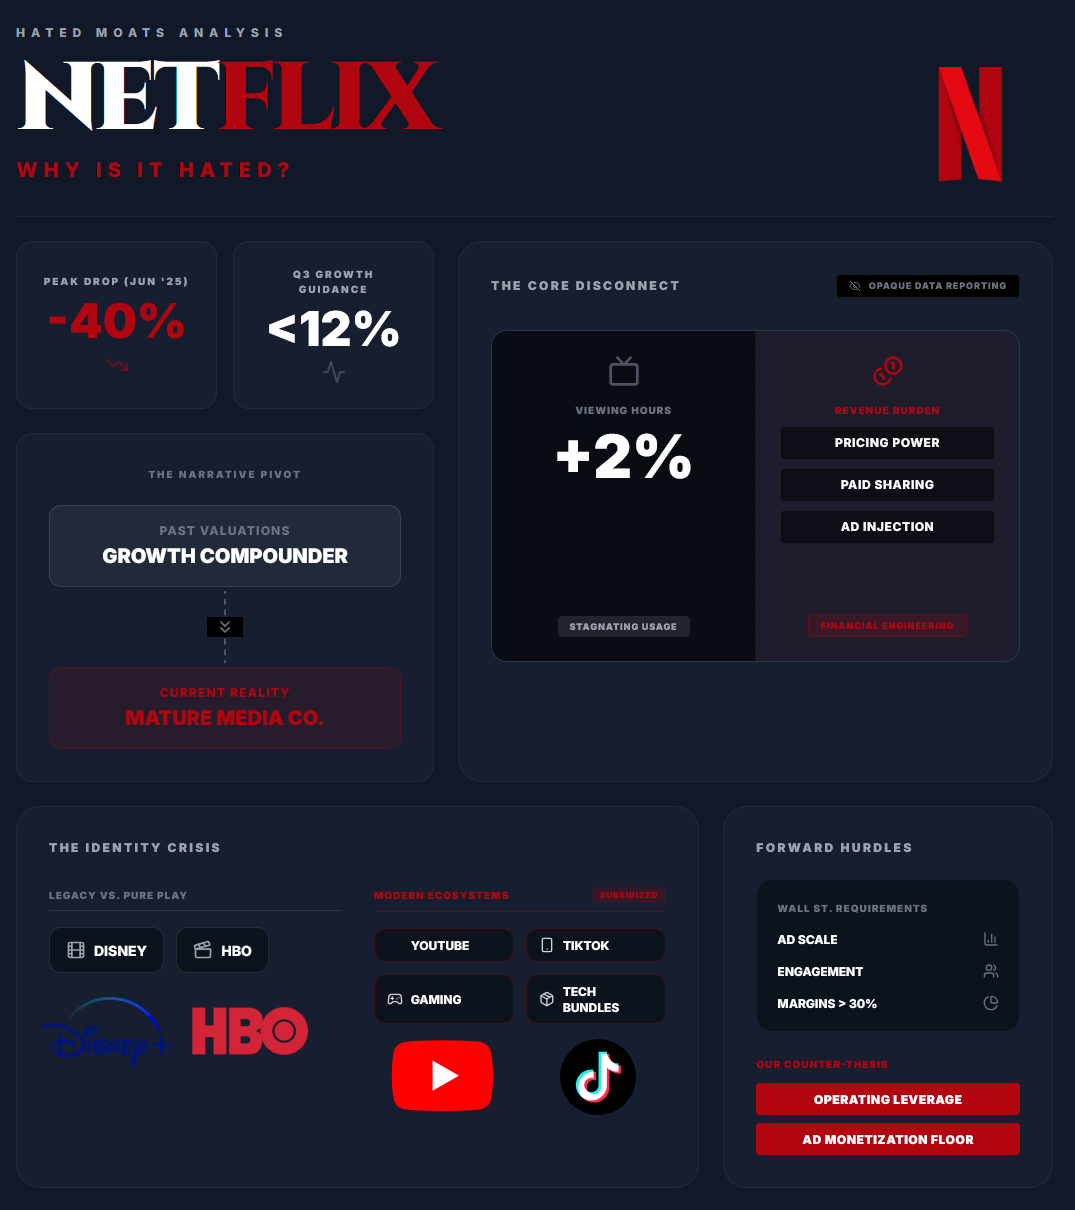
For years, investors valued Netflix as a structurally superior growth compounder. That narrative depended on rapid membership expansion, rising engagement and expanding margins. Today, margins remain excellent and revenue is still growing at a double-digit rate, but the direction of travel, so to speak, has changed. Q3 guidance points to growth below 12%, while the shares have fallen more than 40% from their June 2025 peak.
The market’s central concern is that monetisation is advancing faster than usage. Viewing hours grew only around 2%, leaving pricing, paid sharing and advertising to carry a greater share of revenue growth. That may be sustainable, but it gives investors less confidence that the underlying audience is strengthening at the same pace as the financial results. Netflix’s decision to reduce the frequency of its detailed viewing report has added to that discomfort.
There is also a broader identity problem. Netflix is no longer judged simply against Disney or HBO. It competes with YouTube, TikTok, gaming and bundled ecosystems that can subsidise entertainment through advertising, retail, hardware or other services. Wall Street increasingly fears that Netflix is moving from an exceptional internet platform towards a mature media company with low switching costs, greater competition and permanently high content requirements.
That is why strong results are no longer enough. Investors want proof that advertising can scale, engagement can improve and margins can remain above 30% without excessive pricing or content inflation.
Netflix is hated because the market believes its best growth years may already be behind it. Our thesis is that maturity is real, but the current sentiment may be underestimating how much value Netflix can still create through monetisation, advertising and operating leverage.
Competitive Moat & Peer Comparison
The Moat
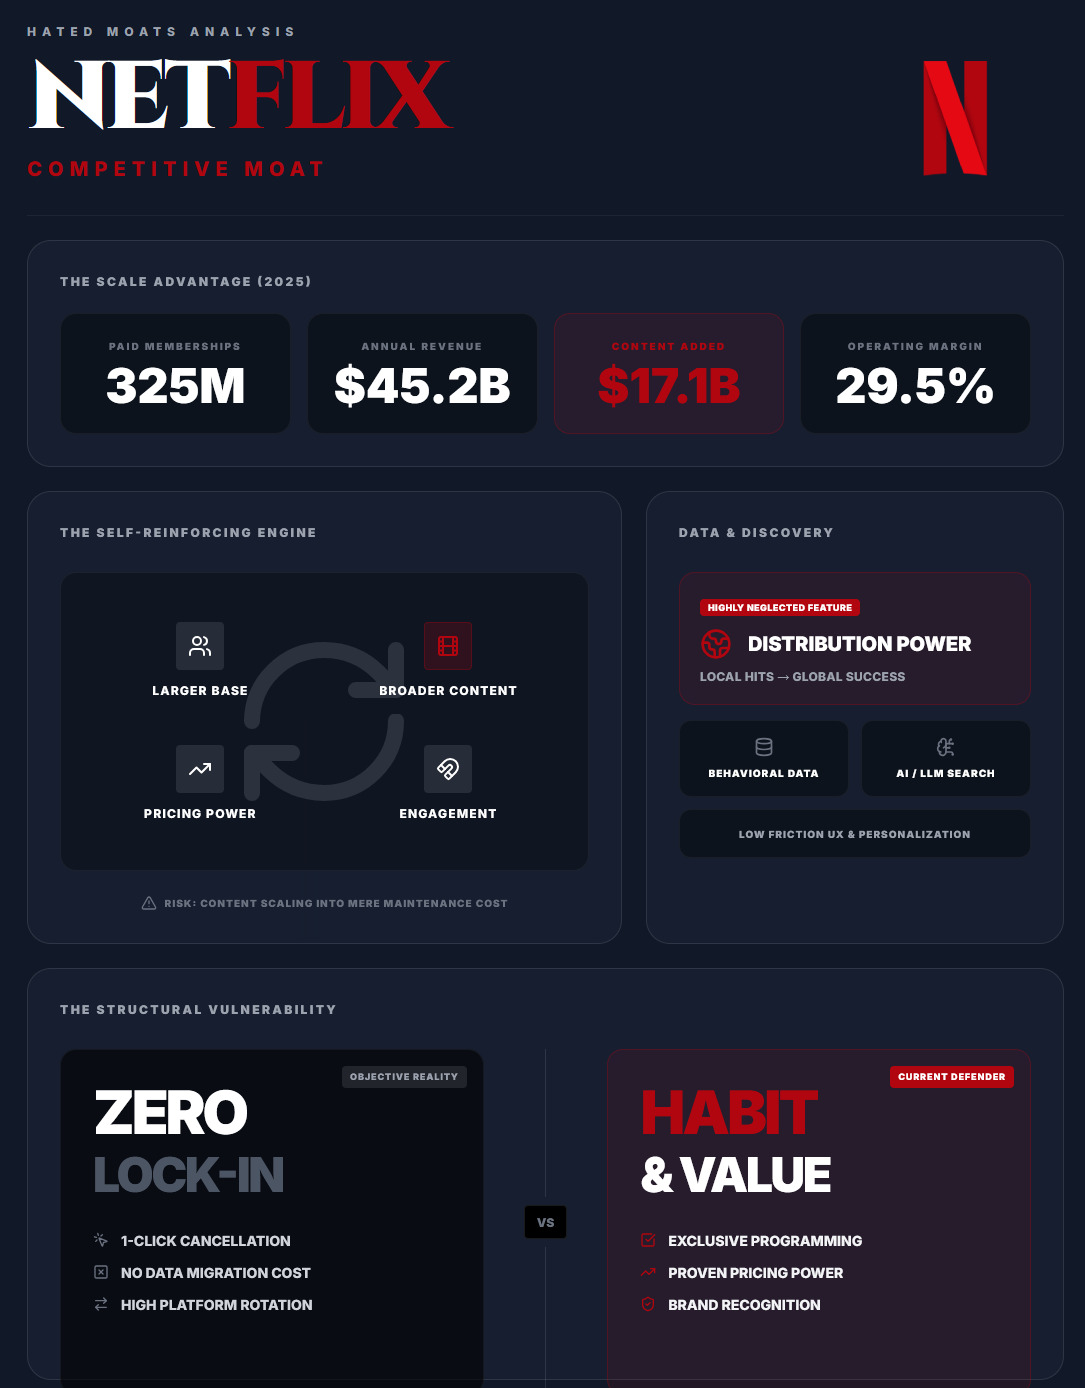
Netflix’s competitive moat is best classified as moderate rather than wide. Its advantage rests on global content scale, proprietary viewing data, brand recognition and superior unit economics. Netflix ended 2025 with more than 325 million paid memberships, generated $45.2B in annual revenue and added approximately $17.1B to its content assets during the year. This gives the company the capacity to fund a broader and more geographically diverse slate than most stand-alone competitors.
The underlying logic is self-reinforcing. A larger subscriber base supports greater content investment, a broader slate increases the probability that members find something worth watching, and stronger engagement supports retention and pricing power. Each additional membership also spreads content, technology and corporate costs across a wider revenue base. Netflix’s continued membership growth, recent price increases and expanding advertising business helped revenue rise 16% in 2025 while its operating margin reached 29.5%.
The content engine is difficult, although not impossible, to replicate. Matching Netflix would require years of investment in production infrastructure, creative relationships, local-language programming, licensing, marketing and global distribution. Disney and Warner Bros. Discovery possess stronger individual franchises in several categories, but Netflix’s advantage lies in breadth, release frequency and its ability to turn locally produced titles into international successes.
This breadth reduces dependence on any single franchise, but it doesn’t eliminate content risk. NFLX 0.00%↑ must continually produce or license programming capable of attracting and retaining members. If hit rates decline, viewing fragments across more platforms, or production inflation outpaces monetisation, content spending could increasingly resemble a maintenance cost rather than a source of incremental competitive advantage. The same scale that currently strengthens the moat could begin to dilute returns if Netflix must spend progressively more simply to maintain engagement.
Personalisation forms the second layer of defensibility. Netflix’s recommendation systems, customised artwork, user profiles, interface testing and search tools reduce discovery friction and increase the probability that members find relevant programming. The individual algorithms are not impossible to reproduce. The advantage comes from Netflix’s accumulated behavioural data, direct relationship with hundreds of millions of memberships and ability to test product changes across a large global audience. What we’ve noticed often being neglected in online discussions, is the sheer distribution power Netflix possesses.
More viewing provides additional information about user preferences, which can improve discovery and reinforce engagement. The pattern of multiple positive-feedback loops is obvious. Netflix is also investing in AI and LLMs to improve title discovery, understand member preferences and support more natural search experiences. However, this advantage could narrow as AI tools become more widely available or if ecosystem competitors use broader cross-service datasets more effectively.
Switching costs remain the weakest component of the moat. Members can cancel quickly, rotate between platforms and maintain several services without meaningful financial or operational penalties. Netflix therefore relies on habit, exclusive programming, product quality and perceived value rather than contractual lock-in, which is, objectively and strictly business-model speaking, the weaker option as far as moat is concerned.
Recent price increases have generally been absorbed without materially disrupting the company’s growth trajectory, supporting the argument that Netflix retains meaningful pricing power. Nevertheless, this loyalty isn’t equivalent to structural captivity. Consumers can still leave when the catalogue disappoints (for long enough period of time), household budgets tighten (economic downturns) or competing services offer more attractive programming.
The Competition
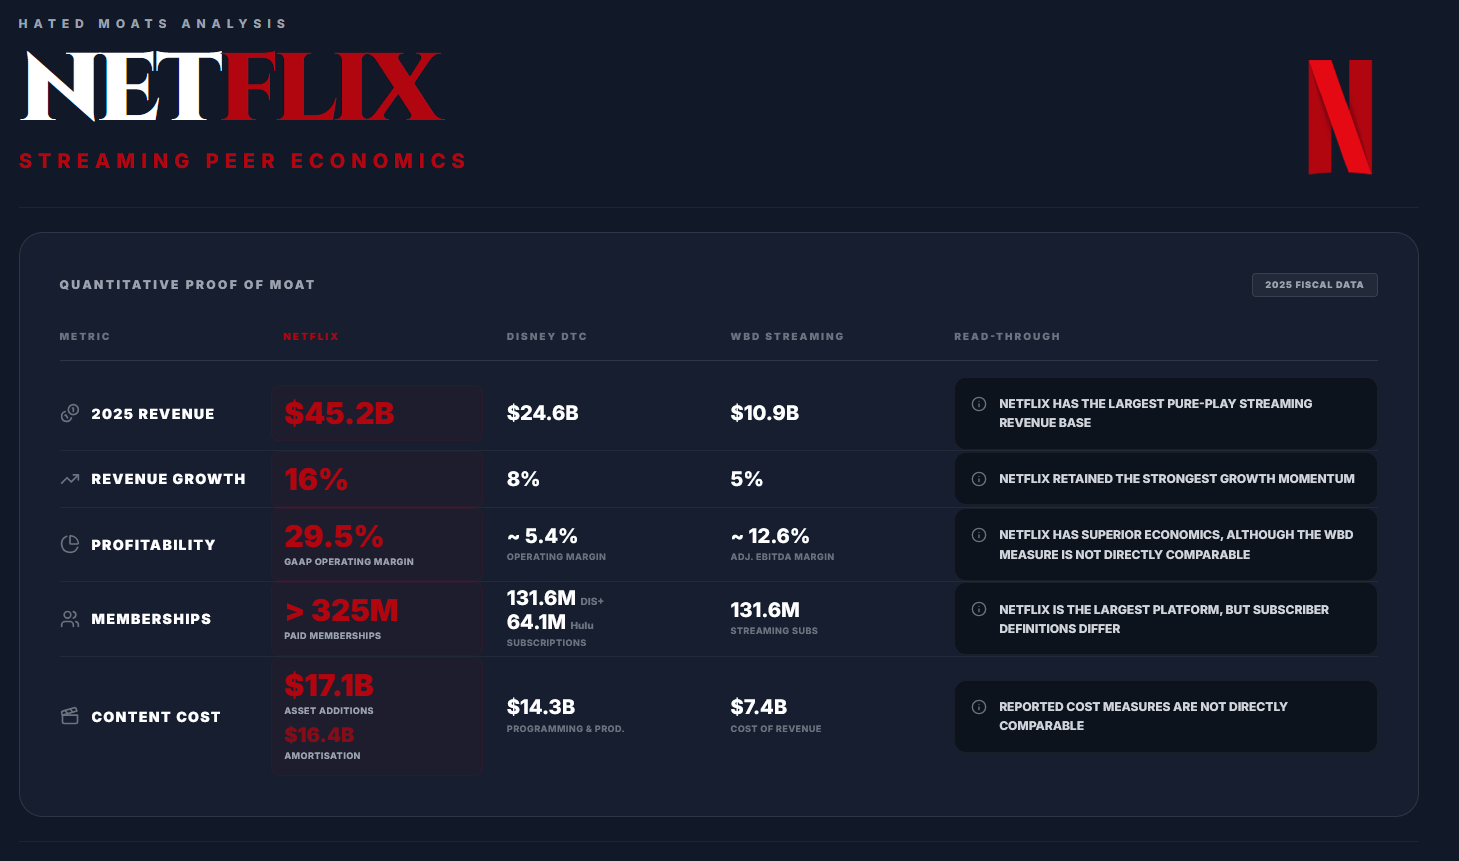
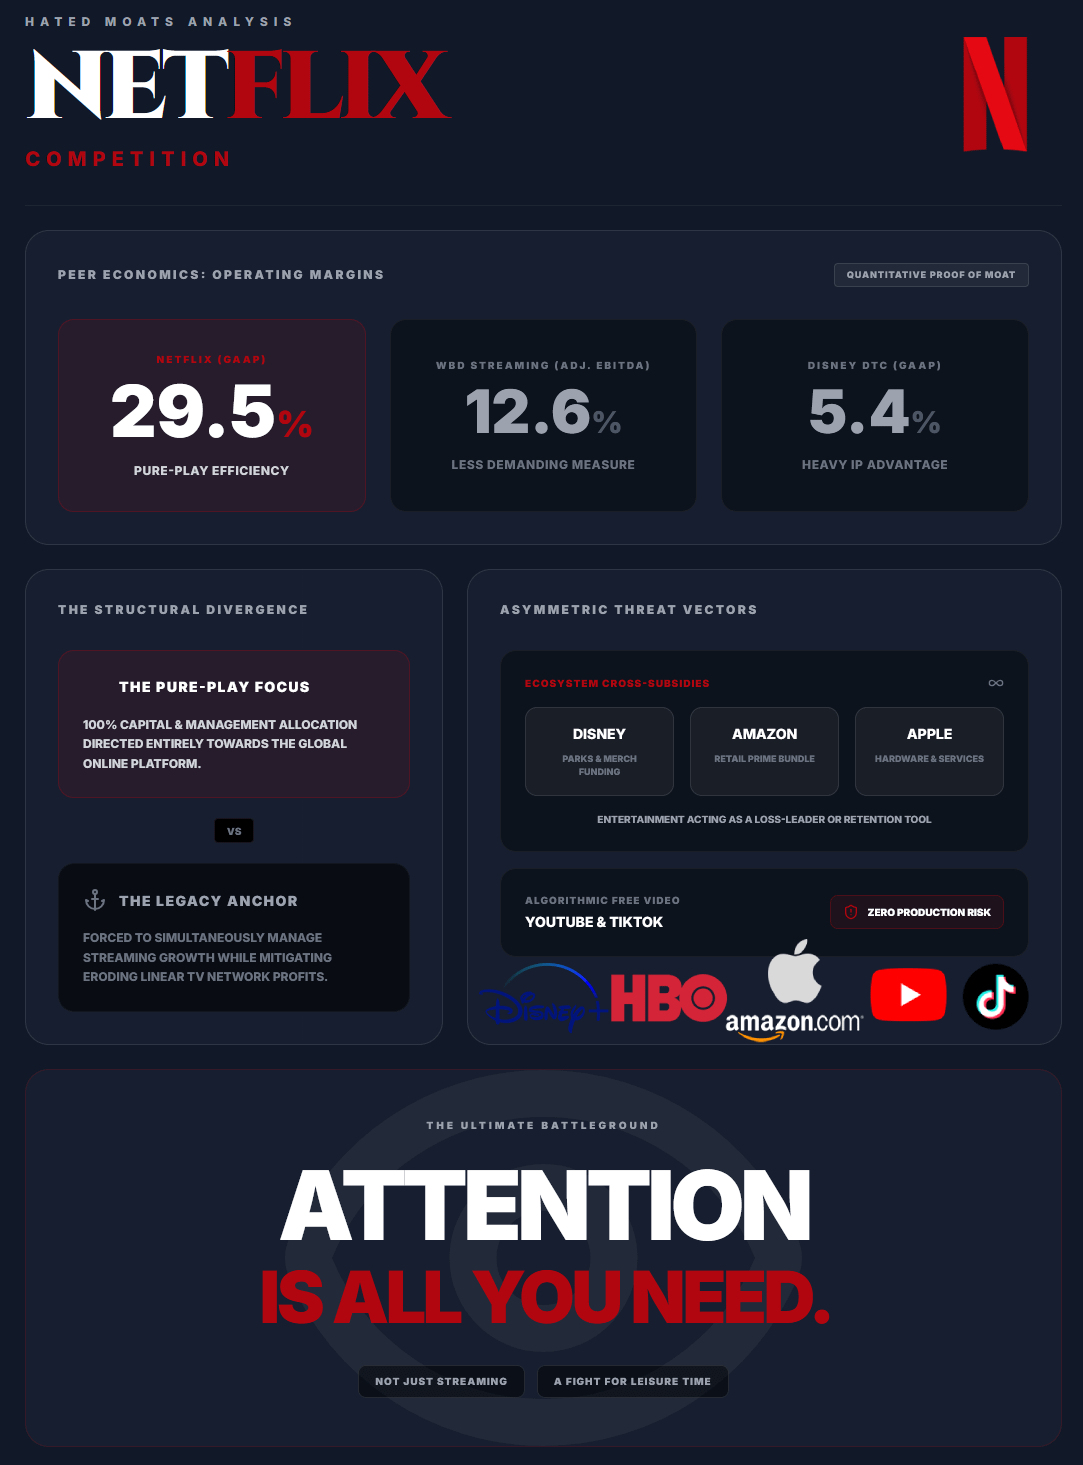
Peer economics provide the strongest quantitative evidence that Netflix’s moat is real. Its 29.5% GAAP operating margin materially exceeded Disney DTC’s approximately 5.4% segment operating margin. WBD Streaming achieved an adjusted EBITDA margin of approximately 12.6%, representing substantial progress, but remaining well below Netflix’s profitability despite using a less demanding non-GAAP measure.
The margin gap suggests that Netflix converts its content and technology infrastructure into revenue more efficiently through global scale, pricing discipline and a focused operating model. Its pure-play structure also avoids much of the legacy cable exposure, declining linear audiences and organisational complexity confronting traditional media groups. Disney and WBD must simultaneously manage streaming growth and the erosion of their historically profitable television networks, while Netflix can allocate capital and management attention almost entirely towards its global entertainment online platform.
The trade-off is that Netflix lacks the diversification and potential cross-subsidies available to larger media and technology conglomerates. Disney DIS 0.00%↑ can monetise intellectual property across streaming, cinemas, consumer products, cruises and theme parks. Amazon AMZN 0.00%↑ can support Prime Video through its wider retail and subscription ecosystem, while Apple AAPL 0.00%↑ can fund premium programming through profits generated by hardware and services.
Disney remains the most dangerous direct competitor because it combines globally recognised franchises, family programming, Hulu and an expanding direct-to-consumer sports offering. Disney doesn’t need every piece of content to generate an adequate return solely through subscription revenue because successful franchises can be monetised across multiple divisions.
Amazon presents a different threat. Prime Video is included within the broader Prime membership proposition, reducing the need for the service to maximise stand-alone streaming profitability. Apple can similarly treat entertainment content as a tool for strengthening its wider ecosystem rather than as an isolated business required to produce Netflix-like margins.
YouTube by GOOGL 0.00%↑ and TikTok represent another form of competition. They offer enormous libraries of free, algorithmically distributed video and compete directly for the same limited pool of leisure time. Their content economics are fundamentally different because much of the programming is created by users rather than financed directly by the platform. This allows them to generate vast volumes of content without carrying the same production risk as a premium streaming service.
These alternatives pressure both viewing hours and consumers’ willingness to pay for another stand-alone subscription. Netflix therefore competes not just against Disney+, HBO Max, Prime Video and Apple TV, but against almost every digital platform seeking to capture a greater share of consumer attention.
Overall, Netflix retains a meaningful but performance-dependent moat. Scale, personalisation, brand recognition, global distribution and industry-leading margins support durable competitive advantages. However, low switching costs, aggressive bundling and the constant need to replenish the content slate prevent a wide-moat conclusion.
The central investment question is whether Netflix can continue converting content investment into engagement, membership growth and pricing power without allowing spending to outrun monetisation. If it can sustain that balance, the content flywheel should continue producing attractive incremental returns. If competitors use franchises, sports, ecosystems, bundling or AI-enabled discovery to capture a greater share of attention, Netflix’s advantage could narrow even while the platform remains the industry leader. All in all, Google was right all along - Attention Is All You Need.
Recent Stock Performance & Market Sentiment
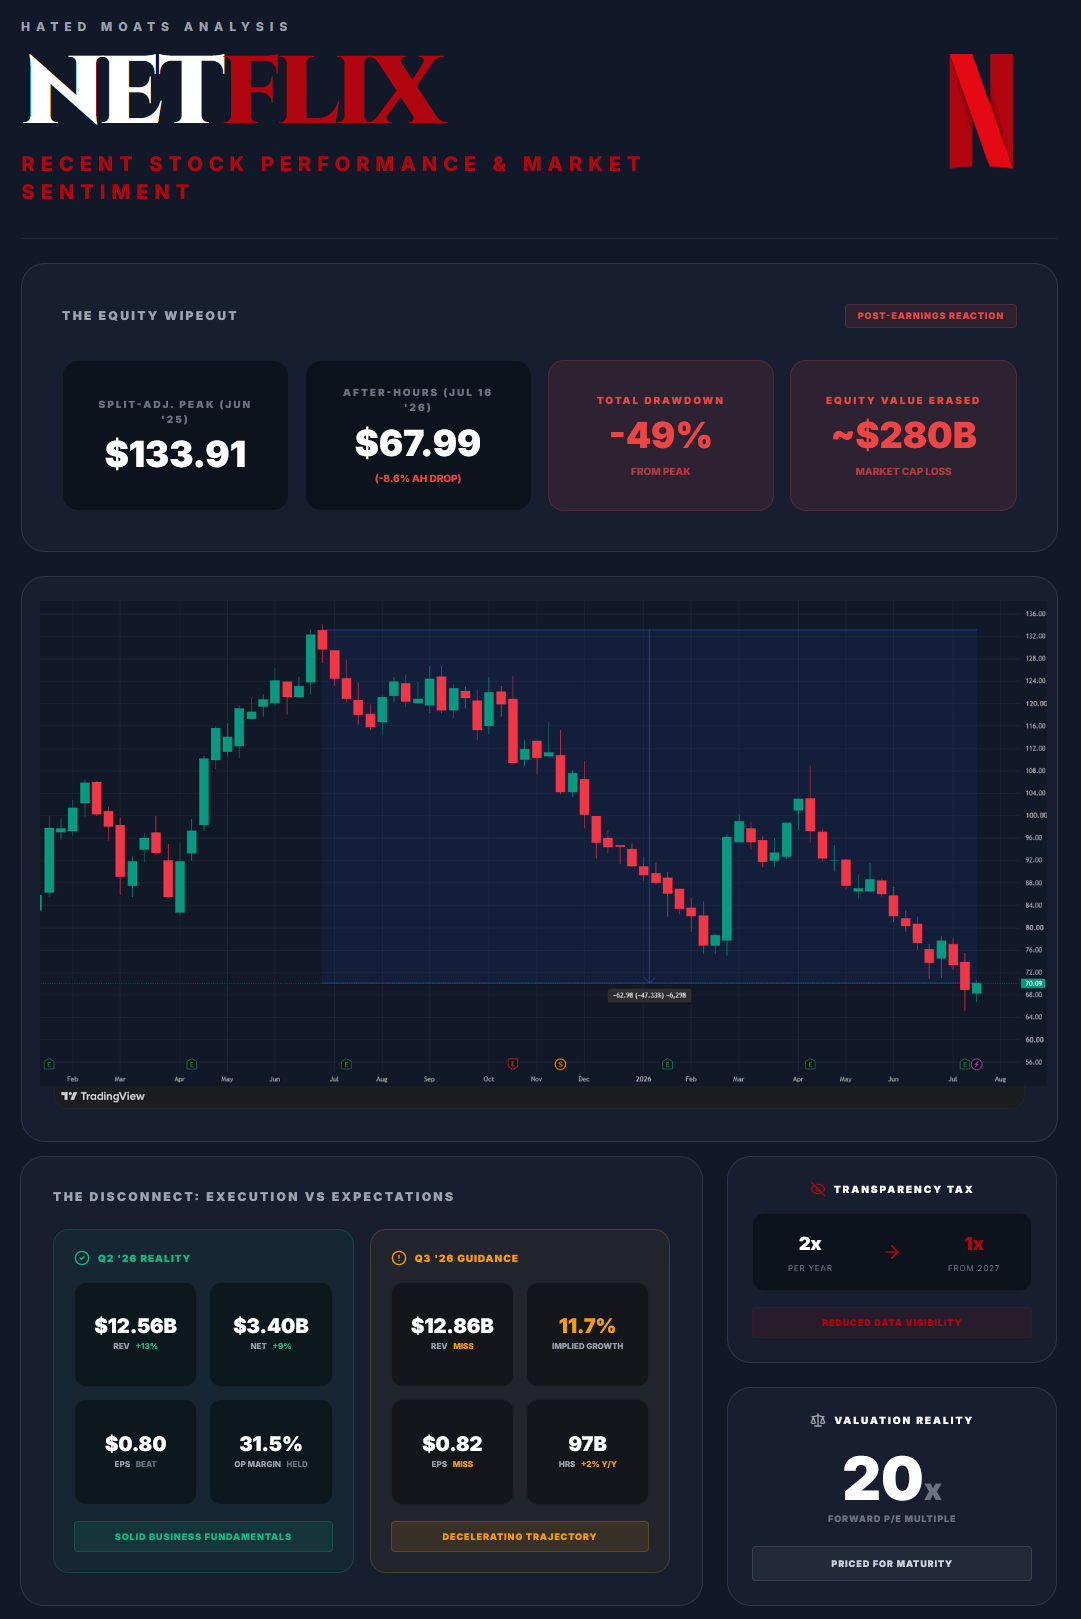
Netflix’s share-price reset has become considerably more severe than the operating results alone would imply. The stock closed July 16, 2026 at $74.35, valuing the company at roughly $313B, before falling approximately 8.6% after hours to $67.99 following the second-quarter release. Before earnings, the shares were down about 21% year to date. On an after-hours basis, the decline widened to roughly 28%, leaving Netflix almost 49% below its split-adjusted June 2025 peak of $133.91. Close to $280B of equity value had disappeared from that high.
The latest print didn’t show a broken business, though. Q2 revenue increased 13% to $12.56B and net income rose 9% to $3.40B, with diluted EPS of $0.80 slightly exceeding consensus. Price increases, membership growth and higher advertising revenue supported the quarter, while management maintained its 31.5% full-year operating-margin target and narrowed 2026 revenue guidance to $51.0B to $51.4B. Netflix also expects advertising revenue to reach approximately $3B this year.
The problem is that expectations remain higher than the reported numbers. Revenue was roughly in line with consensus, but Q3 guidance of $12.86B implied 11.7% growth, the company’s slowest pace since 2023 and below Wall Street’s approximately $13.0B forecast. EPS guidance of $0.82 also missed the consensus estimate of $0.84. For a stock previously valued as a structurally superior compounder, the market is treating deceleration as evidence that pricing, paid-sharing benefits and subscriber expansion are normalising.
Sentiment was already fragile before the release. Netflix had fallen about 31% over the preceding quarter and materially underperformed a rising broader market. Investors had become more sceptical about engagement, the durability of price increases and competition from YouTube, TikTok and bundled streaming platforms. Netflix’s failed pursuit of Warner Bros. Discovery also raised questions about its next phase of growth and capital-allocation priorities, although management described the deal as a “nice to have” rather than a strategic necessity and we also believe that the management did the right thing in this case and handled the whole situation well.
The earnings release reinforced the mentioned concerns. Total viewing exceeded 97 billion hours during the first half, its highest level for any 6-month period, but growth was only 2%. Netflix’s decision to publish its What We Watched engagement report annually rather than semi-annually from 2027 was interpreted negatively because it reduces visibility just as investors are questioning audience momentum. We are “pro-transparency” and generally don’t support discontinuing the reporting of any metrics (or reporting them less frequently than before), especially in a situation like Netflix’s. Management argues that revenue and operating profit are more relevant than aggregate viewing hours, but the market currently wants more evidence, not less disclosure.
The debate is therefore increasingly balanced. Bears see slowing growth, modest engagement gains and a stand-alone subscription competing against free or subsidised ecosystems. Bulls see double-digit revenue growth, expanding profitability, a rapidly scaling advertising business and unmatched global distribution. At around 20x expected earnings following the sell-off, the valuation is no longer extreme, but it still assumes that advertising growth and margin expansion can offset slower core subscription growth.
The July 2026 sell-off reflects a valuation reset rather than a collapse in fundamentals. Netflix is still executing well, but the market no longer appears willing to capitalise that execution as though growth were immune to maturity.
The stock is becoming more interesting precisely because investors are beginning to treat a very good business as though anything short of exceptional is a disappointment.
Fundamental Analysis
Netflix enters the second half of 2026 with a stronger operating model than it had during the early streaming wars, but also with a more mature growth profile. The business is still producing low-to-mid-teens revenue growth, operating margins above 30%, substantial free cash flow and a declining share count.
The July 16 second-quarter print didn’t undermine that thesis. The central change is that growth is decelerating towards the low teens, engagement is expanding modestly, and advertising must become a larger incremental contributor. Netflix is shifting from a subscriber-acquisition story into a monetisation, margin and capital-allocation story.
As we mentioned above, Netflix stopped publishing memberships and average revenue per membership on a regular quarterly basis beginning in 2025, although management said it would continue disclosing major milestones. The company subsequently reported more than 325 million paid memberships at the end of 2025. Quarterly net additions, regional membership figures and average revenue per membership, i.e. the exact data we’d love to see, are no longer disclosed, so more precise 2026 subscriber estimates shouldn’t be presented as reported facts.
Historical cash-flow figures also require careful treatment. Operating cash flow was only $0.4B in 2021 and $2.0B in 2022. In addition, operating income shouldn’t be treated as EBITDA because content amortisation, which reached $16.4B in 2025, is a large and recurring economic cost.
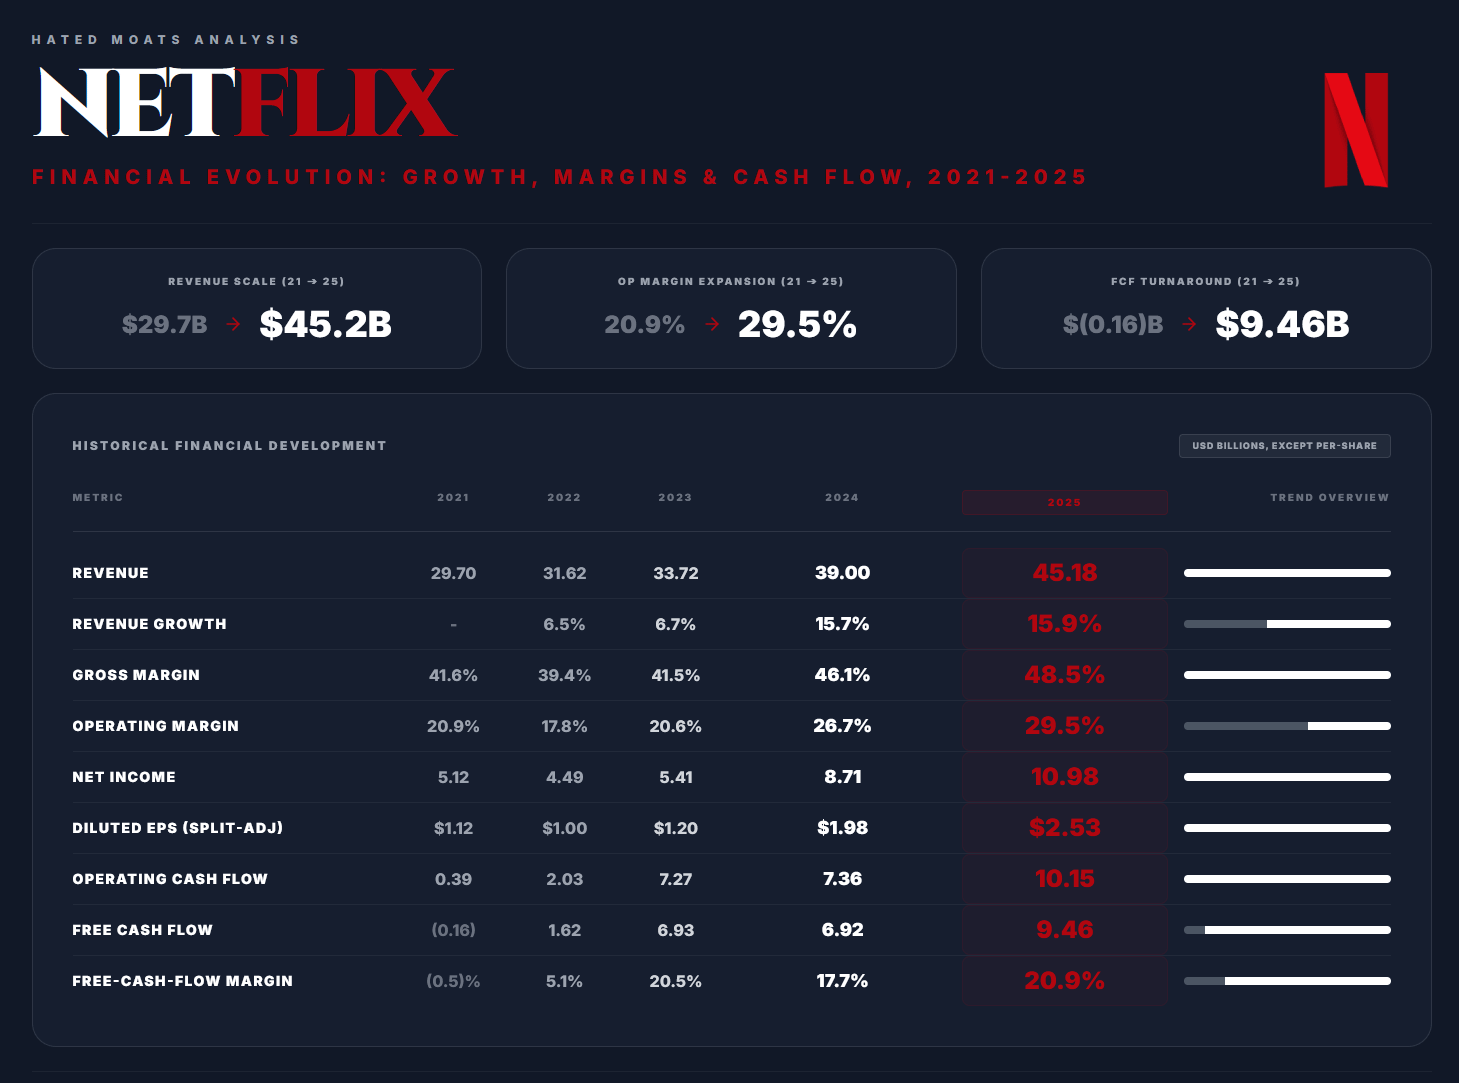
Gross margin is calculated as revenue less cost of revenue, divided by revenue. FCF follows Netflix’s reported non-GAAP reconciliation. The 2021 calculation also included a small change in other assets. Per-share figures are adjusted for the November 2025 10-for-1 stock split.
The history divides into 3 phases. Cash conversion was weak and volatile in 2021 and 2022 because cash content payments materially exceeded content amortisation. The inflection arrived in 2023, when FCF increased to $6.9B. From 2024 onward, paid-sharing monetisation, price increases, stronger content and operating leverage restored mid-teens revenue growth while margins continued expanding. Revenue compounded at approximately 15.8% from 2023 to 2025 and 11.1% from 2021 to 2025. More importantly, operating margin increased from its 17.8% trough in 2022 to 29.5% in 2025, an expansion of almost 12 percentage points.
Revenue Growth & Durability
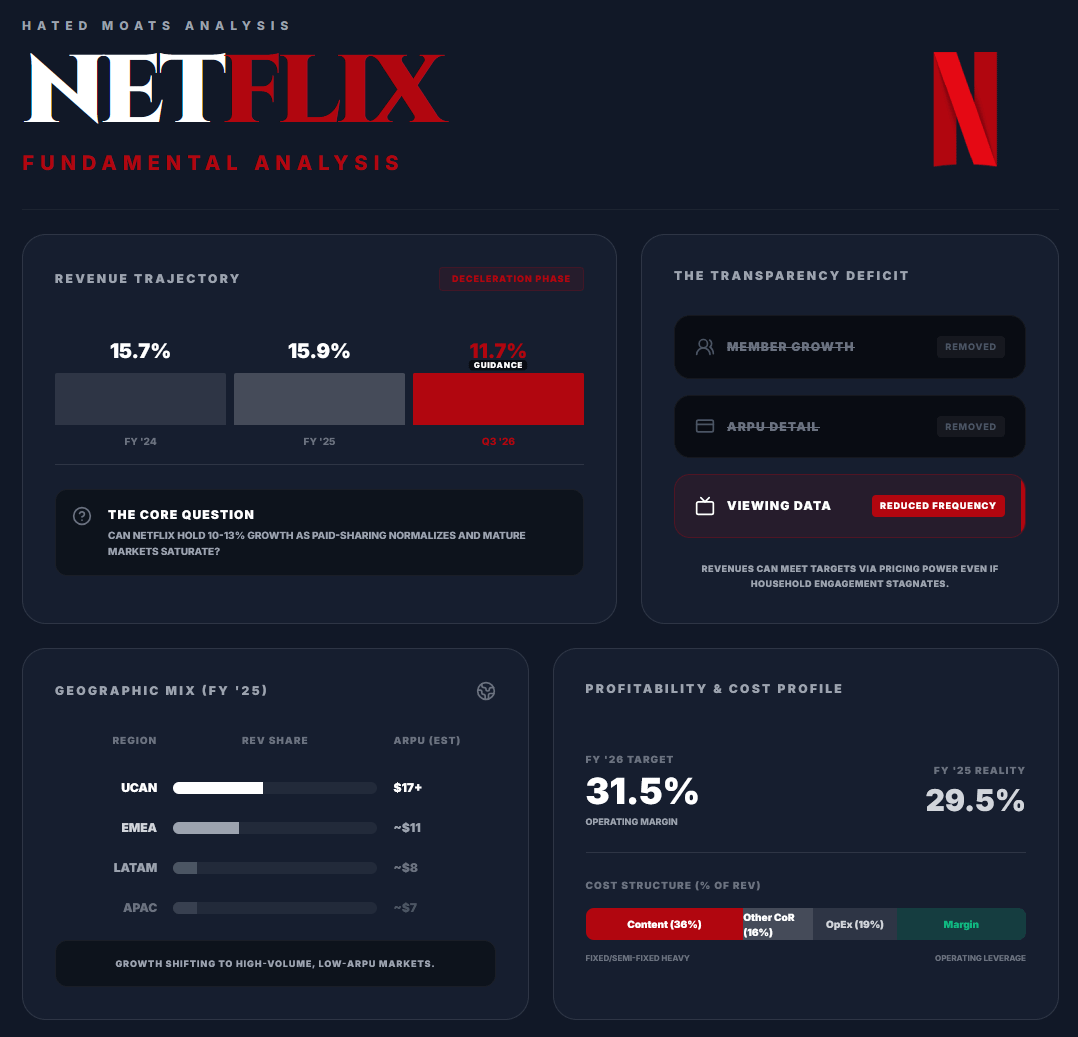
Netflix generated $45.18B of revenue in 2025, up 15.9%, after 15.7% growth in 2024. First-half 2026 revenue reached $24.81B, up approximately 14.8%, while Q2 revenue of $12.56B grew 13.4%. At the midpoint of updated guidance, full-year revenue would increase approximately 13.3%. Q3 guidance of $12.86B implies 11.7% growth, making the near-term deceleration explicit. The relevant underwriting question here is whether Netflix can hold roughly 10% - 13% growth as paid-sharing benefits normalise and mature markets become more penetrated.
Growth continues to come from memberships, pricing and advertising, but the reporting change prevents precise attribution. Netflix’s last comprehensive disclosure showed 301.6 million paid memberships at year-end 2024, up 15.9%, with 41.35 million net additions. Average monthly revenue per membership was $11.70, only 1% above 2023 on a reported basis, indicating that volume remained the principal growth driver while currency and regional mix constrained monetisation. Netflix later disclosed that paid memberships exceeded 325 million by the end of 2025, but didn’t provide the same detailed regional and quarterly breakdown. This can be viewed with deserved scepticism as there appears to be a pattern of “these data don’t look as good, let’s just stop reporting them”…
However, pricing power remains credible. Management said first-half increases in markets including the US, Mexico and Spain performed consistently with previous price changes and internal expectations. Q2 regional results showed no obvious demand shock, with double-digit revenue growth across every region. Nevertheless, Netflix has low contractual switching costs, so repeated increases can encourage subscription rotation when the content slate is weak. Revenue should therefore be assessed alongside engagement rather than price realisation alone.
Advertising is becoming meaningful but is not yet the primary engine. Advertising can expand the addressable market, monetise more price-sensitive households and increase revenue per viewing hour. It also requires Netflix to improve advertiser demand, targeting, measurement and fill rates without degrading the user experience. Advertising is a credible second monetisation channel, but not yet proof that slower subscription growth can be fully replaced.
Geographic & Business Mix
The revenue base is geographically diversified. In 2025, UCAN generated $19.96B, or 44.2% of revenue, EMEA contributed $14.51B (32.1%), Latin America produced $5.36B (11.9%) and APAC generated $5.35B (11.8%). In Q2 2026, reported revenue growth was 10% in UCAN, 14% in EMEA, 21% in Latin America and 16% in APAC. Faster growth outside North America broadens the runway but shifts the mix towards lower-price markets and increases foreign-exchange sensitivity.
The last detailed regional membership data illustrate the monetisation gap. In 2024, average monthly revenue per membership was $17.20 in UCAN, compared with $10.96 in EMEA, $8.24 in Latin America and $7.29 in APAC. International expansion can add strategic scale while producing less near-term revenue per household. Currency also matters as Netflix estimated that 2024 revenue would’ve been approximately $1.42B higher at prior-year exchange rates, with the depreciation of the Argentine peso a major contributor.
Advertising is the most relevant new revenue stream. Live programming, games and AI-enabled production tools remain primarily engagement or efficiency investments. Netflix expects live programming to represent just over 5% of 2026 content spending but only around 1% of viewing hours. However, live events accounted for 6 of the company’s 10 largest new-member sign-up days over the preceding 5 years, suggesting they can create disproportionate acquisition and advertising value. These initiatives shouldn’t yet be modelled as independent profit pools. The core business remains recurring subscription video supported by continuous content reinvestment.
Customer & Operating KPIs
The disappearance of regular membership, net-addition and average-revenue-per-membership disclosure is the largest analytical limitation here (and it also somewhat weakens our excitement about the Hated Moat concept in this case). As we mentioned above, Netflix argues that revenue and operating margin better reflect performance as pricing, paid sharing and advertising make membership comparisons less representative. That has merit, but it still reduces transparency - no matter how the management tries to frame it. Revenue can meet expectations through pricing even while household growth, retention or engagement weakens.
Engagement is the best remaining operating cross-check. Netflix reported viewing hours being up approximately 2% in the first half of 2026, compared with 1.5% growth during 2025. That is positive, but materially slower than revenue growth. The difference reflects price increases, advertising and membership growth, yet it also means monetisation per viewing hour is carrying more of the model. If revenue remains in the low teens while viewing grows only in the low single digits, pricing elasticity and advertising monetisation will become increasingly important.
As we mentioned, Netflix will publish its What We Watched report annually rather than semi-annually beginning in 2027. Investors must consequently rely more heavily on regional revenue, advertising growth, price-change commentary, content rankings and third-party viewing-share data. No single measure replaces churn or membership disclosure, but together they can indicate whether Netflix is increasing engagement or extracting more revenue from a relatively stable audience.
Profitability & Margins
Profitability is the clearest evidence that Netflix’s scale is producing an economic advantage. Gross margin rose from 39.4% in 2022 to 48.5% in 2025, while operating margin expanded from 17.8% to 29.5%. In 2025, revenue grew 15.9%, while cost of revenue increased 10.6%, sales and marketing 13.2%, technology and development 15.9%, and G&A 11.0%. Content amortisation was $16.42B, up 7.3%, allowing operating income to reach $13.33B.
The Q2 print shows that expansion won’t be linear. Operating margin was 33.4%, down from 34.1% a year earlier, while first-half margin was 32.8%, broadly flat against 32.9% in the prior year. Management nevertheless maintained its 31.5% full-year target, which implies approximately $16.1B of operating income at the revenue midpoint and growth of more than 20%. Content-amortisation growth is expected to moderate during the second half and finish the year at approximately 10%. The target appears achievable, although quarterly margins will remain sensitive to release timing and marketing cadence.
Content remains the central cost. Amortisation represented about 36% of 2025 revenue, while total cost of revenue represented 52%. Marketing was 7.3% of revenue, technology and development 7.5%, and G&A 4.2%. Netflix can leverage these costs across a global audience, but content cannot be reduced like ordinary overhead without eventually weakening engagement. Sustainable margins above 30% require revenue per dollar of content amortisation to keep improving, not just tighter corporate spending.
Earnings Quality
At the operating level, earnings quality is high. Netflix expenses stock-based compensation, includes content amortisation in cost of revenue and doesn’t depend on aggressively adjusted profit measures. The 2025 effective tax rate was 13.7%, but operating-income growth, rather than tax accounting, remained the principal earnings driver.
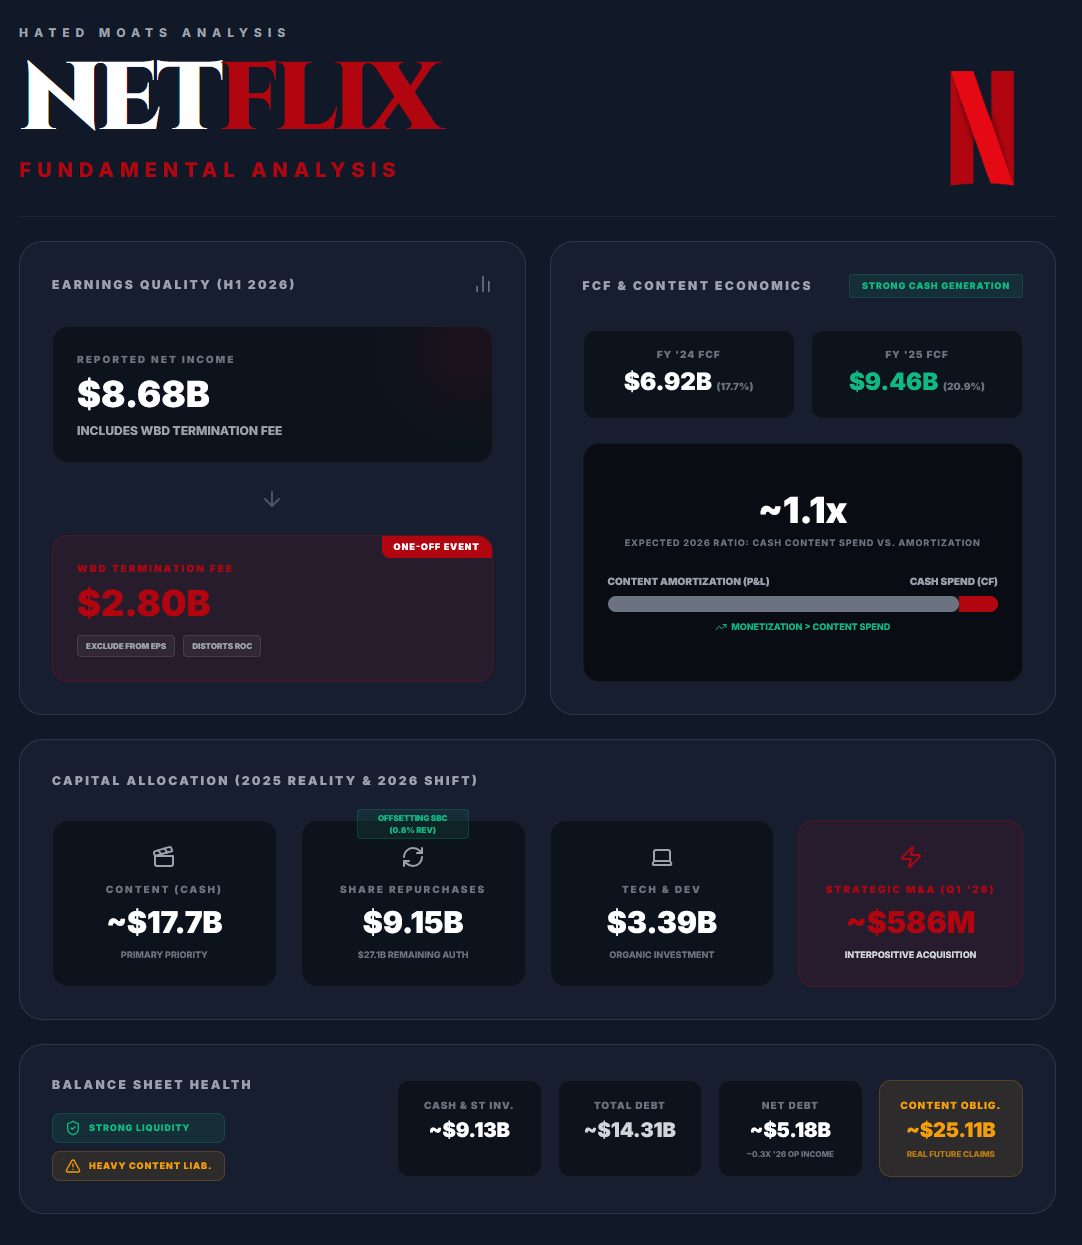
The major exception is first-half 2026. Netflix received a $2.8B termination fee connected with the proposed Warner Bros. Discovery transaction and recorded it in interest and other income during Q1. Consequently, Q1 net income of $5.28B and first-half net income of $8.68B materially overstate recurring earnings growth. The fee is real cash, but it should be excluded from normalised EPS, return-on-capital and valuation analysis.
This makes unadjusted trailing P/E misleading. That’s why operating income, normalised after-tax earnings and FCF adjusted for the fee and associated taxes are more useful until the gain rolls out of the trailing period.
Free Cash Flow & Content Economics
Netflix produced $9.46B of FCF in 2025, a 20.9% margin, compared with $6.92B and 17.7% in 2024. The trend is strong, but the longer history is important here. FCF was negative $0.16B in 2021 and only $1.62B in 2022. Cash generation improved as revenue accelerated and cash content spending moved closer to amortisation.
Physical capital expenditure was only $688 million in 2025, but Netflix isn’t economically asset-light in the same way as a software company. Cash payments for content pass through operating cash flow. Content additions plus the reduction in content liabilities imply approximately $17.7B of 2025 cash content spending, compared with $16.4B of amortisation, a ratio of roughly 1.08 times. In first-half 2026, the ratio was approximately 1.16x, while management expects around 1.1x for the full year. FCF already includes these payments, but the low PP&E figure shouldn’t be interpreted as Netflix’s full reinvestment burden.
Q2 FCF was $1.53B, down from $2.27B despite higher operating profit, mainly because of increased content payments, working-capital movements and higher cash taxes related partly to the termination fee. First-half FCF was $6.62B, but included the $2.8B cash receipt. Management continues to guide to approximately $12.5B for 2026.
The headline guidance implies FCF margin of roughly 24%, but it’s not a clean recurring run rate. A simple gross adjustment for the fee would reduce the figure to about $9.7B, although that understates the normalised result because Netflix also paid additional taxes related to the fee. The exact after-tax contribution hasn’t been disclosed. We can conclude that the underlying cash generation remains strong, but its increase is materially smaller than the reported guidance suggests.
Cash conversion will fluctuate with production and licensing schedules. The key full-cycle relationship is revenue growth relative to cash content spending. Netflix currently benefits because monetisation is expanding faster than content requirements. Renewed content inflation or a weaker hit rate could reverse that leverage.
Stock Compensation & Dilution
SBC was $368 million in 2025, only 0.8% of revenue, although it rose to $272 million, or 1.1% of revenue, during first-half 2026. It’s included in GAAP expenses and should be treated as a real cost. Repurchases have more than offset issuance. Diluted weighted-average shares fell from approximately 4.50B in 2023 to 4.34B in 2025, while Q2 2026 diluted shares were 2% lower YoY.
Netflix spent $9.15B on buybacks in 2025 and approximately $5.98B in first-half 2026. Dilution risk is therefore low, but value creation still depends on the purchase price. Repurchases at elevated multiples can improve EPS without necessarily producing an adequate return on capital.
Balance Sheet & Financial Risk
The balance sheet is strong but not net cash. At June 30, 2026, Netflix held approximately $9.13B of cash, restricted cash and short-term investments against $14.31B of debt, leaving net debt of about $5.18B. Current assets of $13.85B exceeded current liabilities of $12.13B, producing a current ratio of approximately 1.14. Net debt represents roughly 0.3x guided 2026 operating income, while first-half operating income covered interest expense almost 19x.
Netflix also has an undrawn $3B revolving credit facility and a $3B commercial-paper programme. Conventional solvency risk is thus low. The larger commitment is content. Streaming content obligations were $25.11B at quarter-end, while net content assets stood at $33.84B. These aren’t identical to funded debt, but they are real claims on future cash flow and make the operating cost base less flexible than the net-debt ratio alone suggests.
Capital Allocation & Strategic Investment
Capital allocation prioritises content and product investment, liquidity, selective acquisitions and share repurchases. Netflix doesn’t pay a dividend. In 2025, it spent approximately $17.7B in cash on content, $3.39B on technology and development, and $9.15B on buybacks. The board added $25B to the repurchase authorisation in April 2026, leaving $27.1B available after Q2. This flexibility is valuable, but it increases the importance of valuation discipline.
The claim that Netflix undertakes virtually no meaningful M&A is now outdated. It paid approximately $586 million in cash to acquire InterPositive, an AI-focused filmmaking technology company, during Q1. The proposed WBD transaction and subsequent $2.8B termination fee also demonstrate a willingness to consider strategically significant deals. Netflix still describes itself as primarily a builder rather than a buyer, but larger transactions would introduce integration, valuation and regulatory risks that historically were less central to the thesis.
Organic investment still appears to offer the strongest returns. Advertising technology, live programming, games and generative-AI workflows may improve retention or production efficiency, but each should be assessed against measurable revenue and cost outcomes. Management said generative-AI workflows had been used across roughly 300 titles to date, predominantly in post-production. This demonstrates adoption, but not yet a material contribution to earnings.
Returns On Capital
Using average book equity, 2025 return on equity was approximately 43%. A conventional ROIC calculation falls within the low-to-mid 30% range, depending on the treatment of cash, leases, taxes and content liabilities. That is comfortably above a reasonable cost of capital and supports the conclusion that Netflix creates economic value.
We should keep in mind that buybacks reduce book equity and mechanically raise ROE, while accounting capital doesn’t capture the full value of Netflix’s brand, data and internally developed capabilities. The defensible conclusion is that operating profit and cash flow have grown faster than invested financial capital and that returns remain high despite continuous content reinvestment.
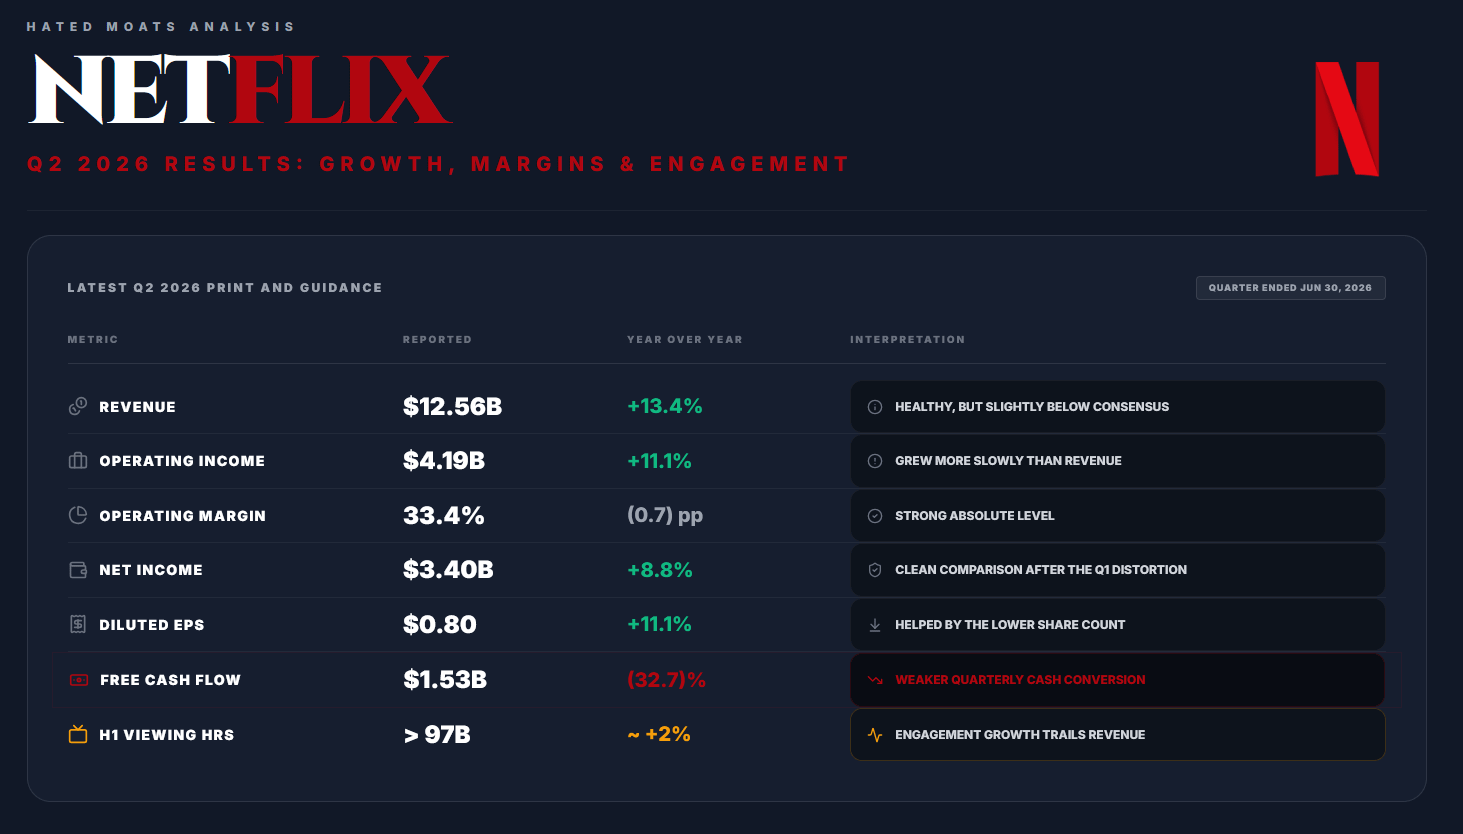
The Q2 2026 release was good rather than exceptional. Revenue was approximately $23 million below the consensus recorded immediately after the print, while EPS exceeded consensus by one cent. The negative reaction reflected the small revenue miss, Q3 growth guidance below 12%, weaker quarterly cash conversion and concern over low-single-digit viewing growth. It didn’t reflect a material reduction in annual guidance.
Q3 guidance is the main caution. Revenue of $12.86B would grow 11.7%, with a 33.2% operating margin. That remains high-quality growth, but the gap between Netflix and more mature media or internet platforms is narrowing. Sustained low-teens growth with margins above 30% would support continued compounding. A move into single-digit growth would make valuation and cash yield considerably more important.
Valuation & Implied Expectations
Using the July 23, 2026 closing price of $68.89 and the 4.164B shares outstanding at June 30, Netflix’s equity value was approximately $287B. Adding $5.18B of net debt produces an enterprise value of roughly $292B. Period-end shares are appropriate for estimating current market capitalisation, although our DCF uses the Q2 weighted-average diluted share count as a more conservative basis for intrinsic value per share.
At this price, Netflix trades at approximately 5.7x the midpoint of 2026 revenue guidance and 18.1x guided operating income on an enterprise-value basis. Market capitalisation is around 22.9x the $12.5B FCF forecast, equivalent to a headline yield of approximately 4.4%.
The headlineFCF multiple overstates recurring cash generation because the guidance includes the benefit of the $2.8B WBD termination payment and associated tax effects. Using approximately $11B as a cleaner underlying baseline raises the multiple to roughly 26x and reduces the normalised cash-flow yield to about 3.8%. Trailing P/E is similarly distorted. Enterprise value to operating income is cleaner because it excludes the gain while retaining content amortisation as a genuine recurring expense.
Our DCF produces a base-case intrinsic value of $88.50 per share. At $68.89, this represents approximately 28.5% upside and a margin of safety of roughly 22%. The $57 bear case implies approximately 17% downside, while the $115 bull case implies about 67% upside. These are estimates of intrinsic value today, not three-to-five-year price targets.
You can read the whole DCFriday article about Netflix valuation here:

Our valuation leaves some room for growth deceleration, but limited protection against a deeper deterioration in engagement, advertising execution or content productivity. Single-digit growth arriving earlier than modelled, margins failing to expand or renewed content inflation would place meaningful pressure on intrinsic value.
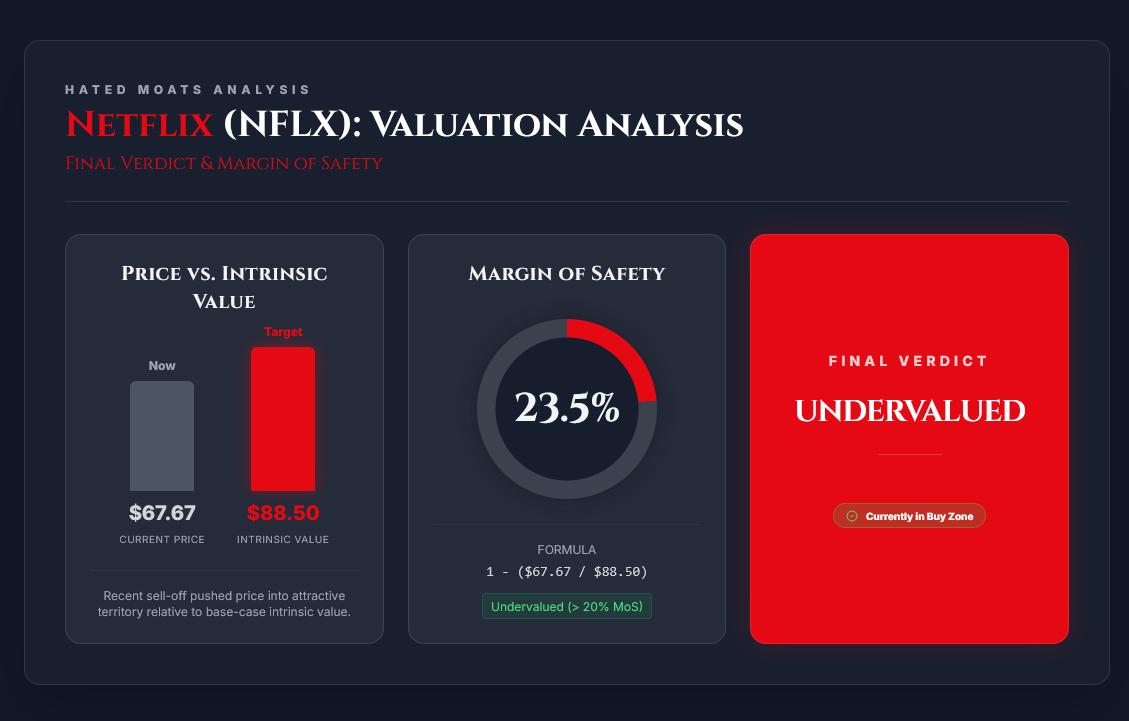
Overall, Netflix remains a fundamentally high-quality compounder trading below our estimate of fair value, but it’s not really conventionally cheap on normalised cash flow. The investment case rests on Netflix converting slower audience growth into stronger monetisation and margins without weakening the product. At the current price, we believe the risk-reward is favourable, but the 22% margin of safety is meaningful rather than exceptional.
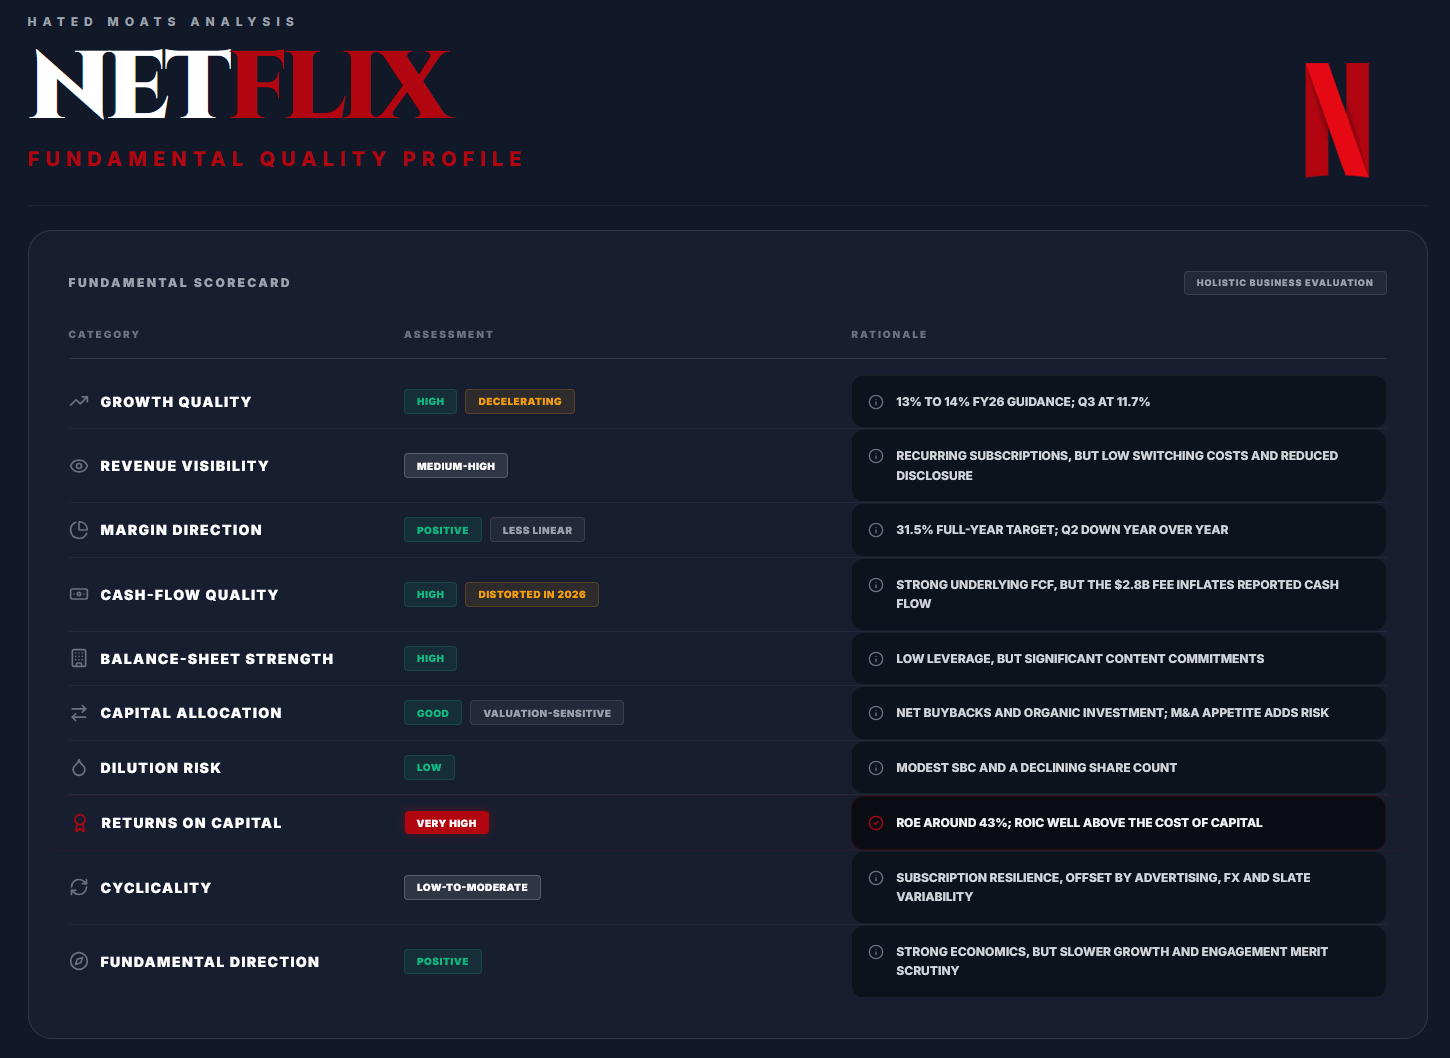
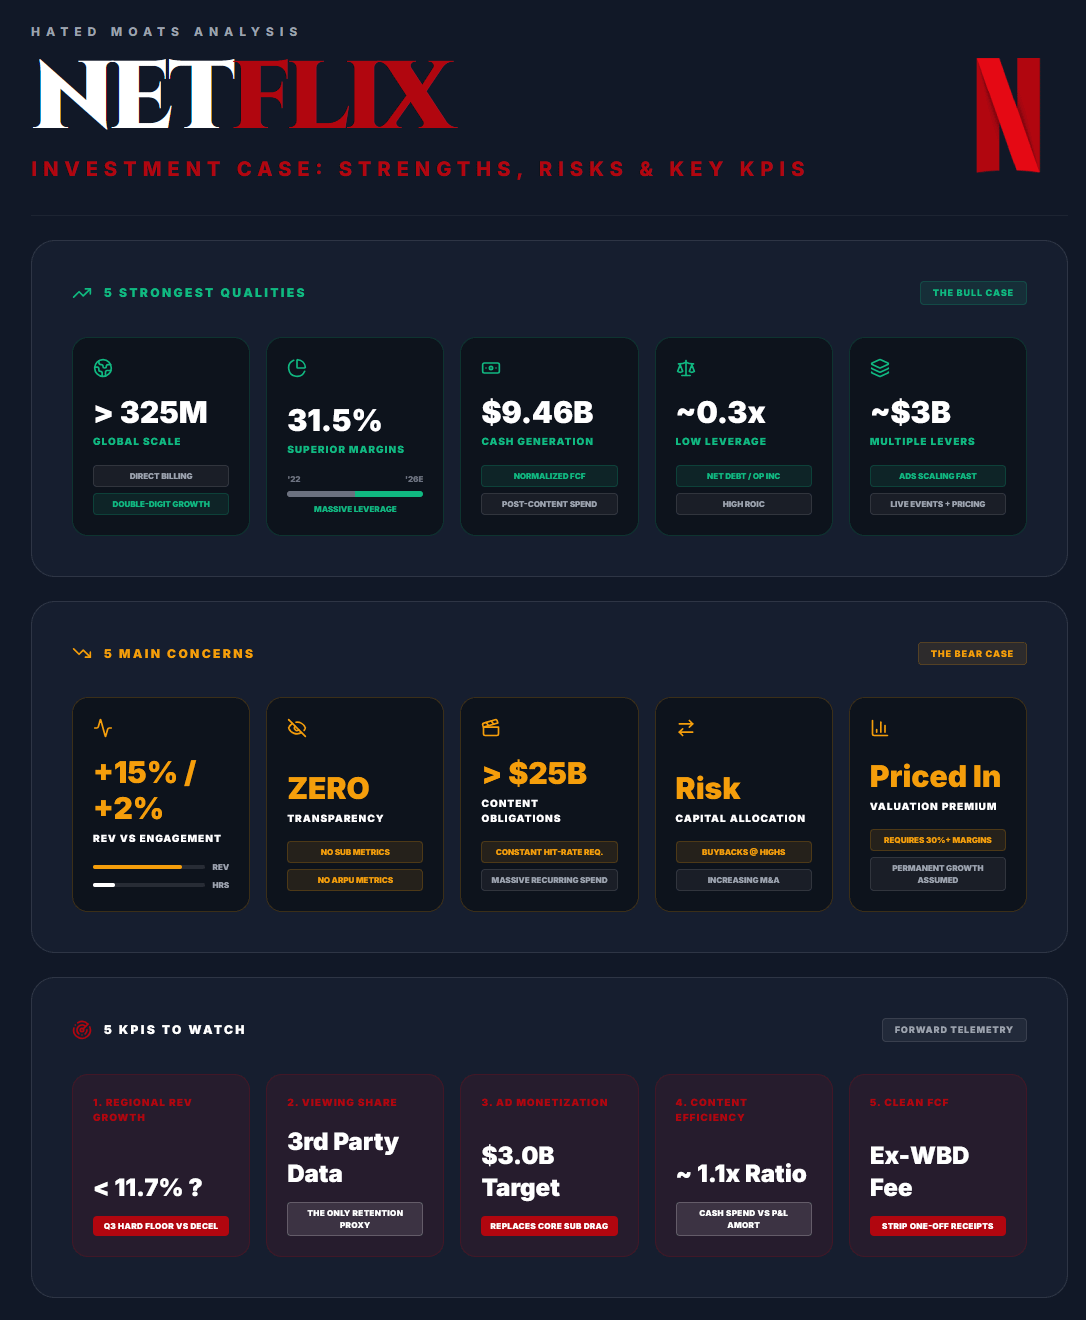
Five Strongest Qualities
1.) Global monetisation scale
Netflix combines a very large audience with direct billing, global distribution and local-content capabilities, supporting double-digit revenue growth after the paid membership base exceeded 325 million.
2.) Superior profitability
Operating margin expanded from 17.8% in 2022 to 29.5% in 2025, with 31.5% guided for 2026, demonstrating leverage across content, technology and marketing.
3.) Strong normalised cash generation
FCF reached $9.46B in 2025 after content payments. Even excluding the 2026 termination fee, Netflix has become a durable cash generator.
4.) Low leverage and high returns
Net debt is approximately $5.2B against roughly $16.1B of guided operating income, while returns on capital remain materially above the cost of capital.
5.) Multiple monetisation levers
Pricing, paid sharing, advertising and selective live programming provide growth options beyond membership additions. Advertising approaching $3B is now financially meaningful.
Five main concerns
1.) Revenue is outgrowing engagement
First-half of 2026 viewing increased approximately 2% while revenue rose almost 15%. Monetisation can bridge the gap, but a persistent divergence could eventually pressure retention.
2.) Reduced transparency
Netflix no longer regularly reports memberships, net additions or average revenue per membership, making the composition and durability of growth harder to assess.
3.) Large recurring content commitments
Annual cash content spending is approaching $20B and total obligations exceed $25B. A weaker hit rate would pressure engagement and cash flow.
4.) More ambitious capital allocation
Aggressive buybacks at elevated prices and a greater willingness to pursue acquisitions could increase the risk of reinvestment at inadequate returns.
5.) Valuation still requires excellence
The valuation continues to assume sustained double-digit growth and margins above 30%.
Five KPIs to watch
Reported and FX-neutral regional revenue growth, particularly whether Q3’s 11.7% rate becomes a floor or the beginning of further deceleration.
Engagement growth and third-party viewing share, the best available indicators of retention following the reduction in membership disclosure.
Advertising revenue and ad-tier monetisation, including progress towards the approximately $3B 2026 target.
Cash content spending and amortisation relative to revenue, especially whether the cash-spend-to-amortisation ratio remains near 1.1x.
Operating margin and normalised FCF, excluding the WBD termination fee, related taxes and production-payment timing.
Most important fundamental question
Can Netflix sustain approximately double-digit revenue growth and operating margins above 30% as audience growth matures and engagement rises only modestly, or will it require progressively more pricing, advertising load and content investment to maintain the same financial trajectory?
Management Quality & Insider Activity
Netflix is led by co-CEOs Ted Sarandos and Greg Peters, an unusually complementary pairing. Sarandos has overseen content since 2000 and led Netflix’s expansion into original programming, while Peters joined in 2008 and previously ran product, technology and global operations. This division of expertise has worked. The company successfully expanded internationally, built a global production network and, following the 2022 slowdown, introduced paid sharing and advertising despite management’s earlier resistance to both. That willingness to reverse prior assumptions is a positive indicator of decision quality. Founder dependence has also declined materially. Reed Hastings moved from executive chairman to a non-executive chairman role in April 2025 and left the board following the June 2026 annual meeting, completing an orderly multiyear succession.

The principal governance risk is that the co-CEO structure can blur accountability, particularly as Netflix expands beyond subscription streaming into advertising, live events, games and selective acquisitions. Executive pay is also substantial. Sarandos received reported compensation of $53.9 million in 2025, while Peters received $53.2 million. Most of this consisted of equity awards, with half of long-term incentives delivered through performance-based units tied to Netflix’s shareholder returns relative to the S&P 500. Netflix also requires each co-CEO to build ownership equal to 6x base salary within the applicable 5-year period.
Netflix’s workplace model is relevant to investors because it is deliberately more demanding than conventional corporate culture. The company describes itself as a professional sports team rather than a family, pays “personal top of market,” applies a “keeper test” to employees and assigns significant decisions to individual “informed captains.” Its vacation policy is simply “Take vacation,” and decision-makers are expected to “farm for dissent” before committing. This structure can support speed, candour and creative risk-taking, but may also create elevated performance pressure and retention risk in important creative and technical roles.
Insider activity has been net negative but is not, by itself, an alarming signal. Peters sold 105,781 shares in January 2026 under a Rule 10b5-1 plan adopted in October 2025, followed by another 27,312 shares in February. Sarandos sold 27,312 shares in May after quarterly RSU vesting, while Peters sold a further 27,312 shares later that week. Sarandos also adopted a new Rule 10b5-1 plan in May covering the potential exercise and sale of up to 643,224 shares through April 2027. No significant discretionary open-market purchases by senior executives were identified. The pattern warrants monitoring, particularly given the scale of the new Sarandos plan, but planned sales, vesting, tax withholding and portfolio diversification limit the usefulness of insider selling as a standalone bearish indicator. Open-market purchases, on the other hand, would be a strong signal at the current levels, surely appreciated by investors and helping with sentiment recovery.
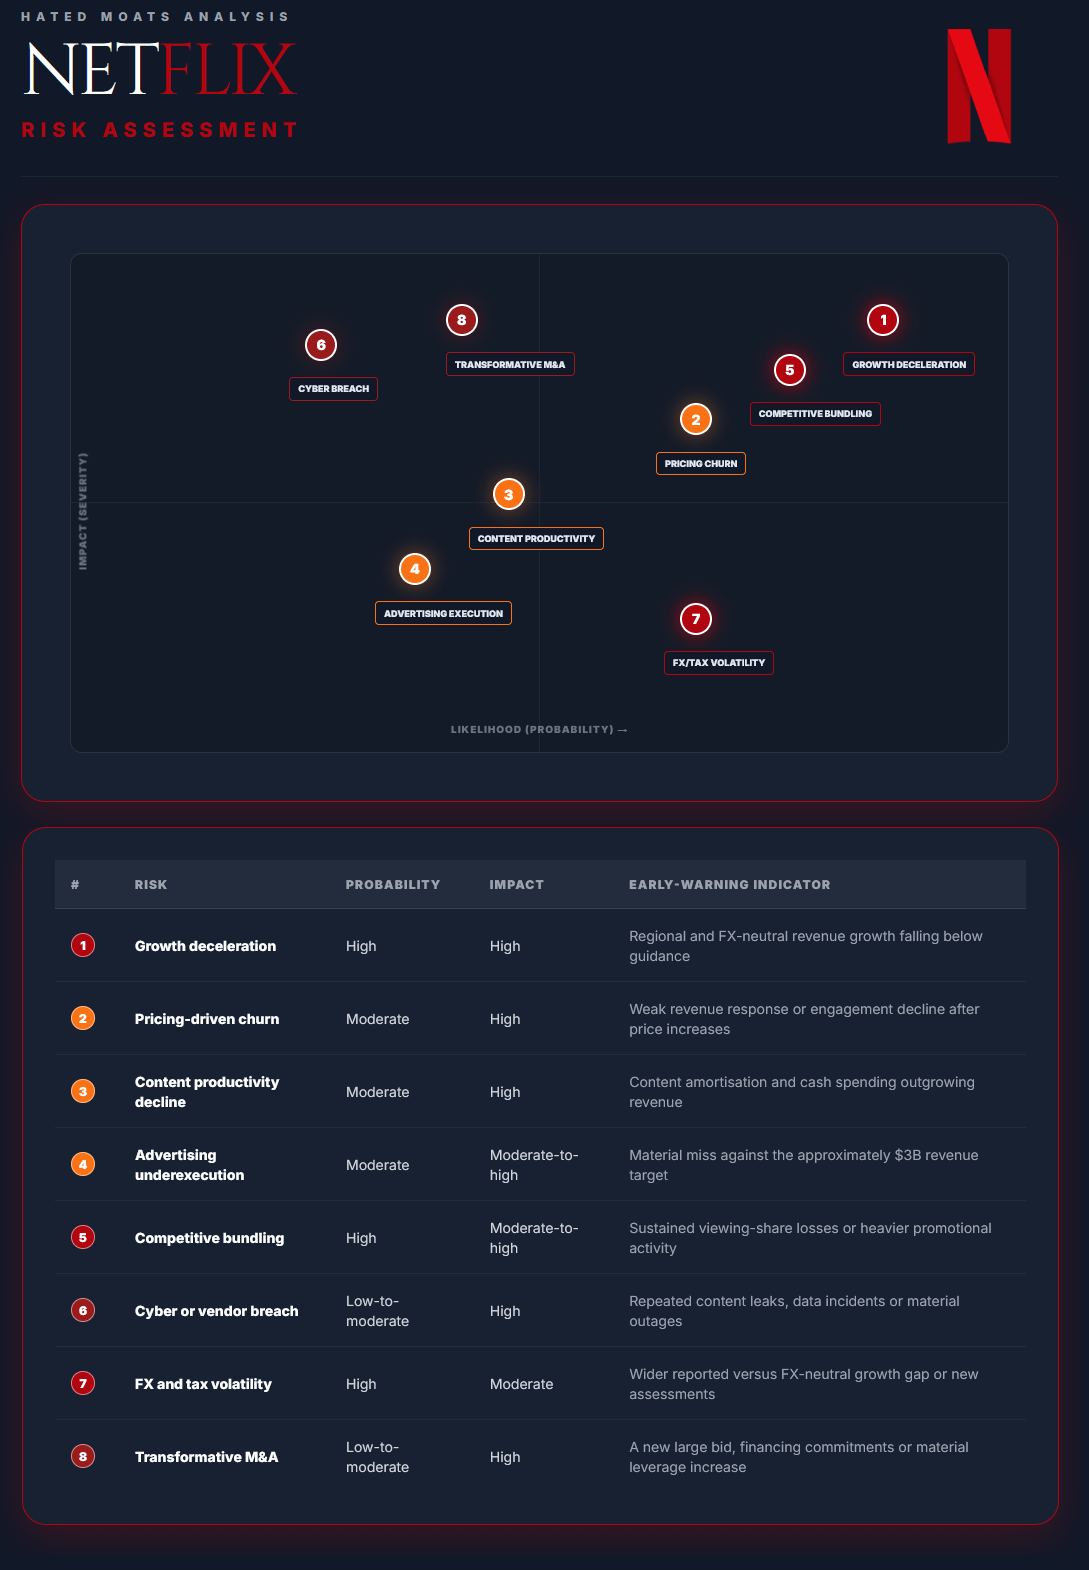
Risk Factors
Netflix’s risk profile has improved materially since the cash-burning phase of the streaming wars. With operating margins above 30%, strong FCF and modest net leverage, its principal vulnerabilities are no longer immediate liquidity or solvency. The main risks are structural growth deceleration, reduced visibility into customer behaviour, declining content productivity and an increasing dependence on monetisation to compensate for modest engagement growth.
Subscriber Maturity & Reduced Disclosure
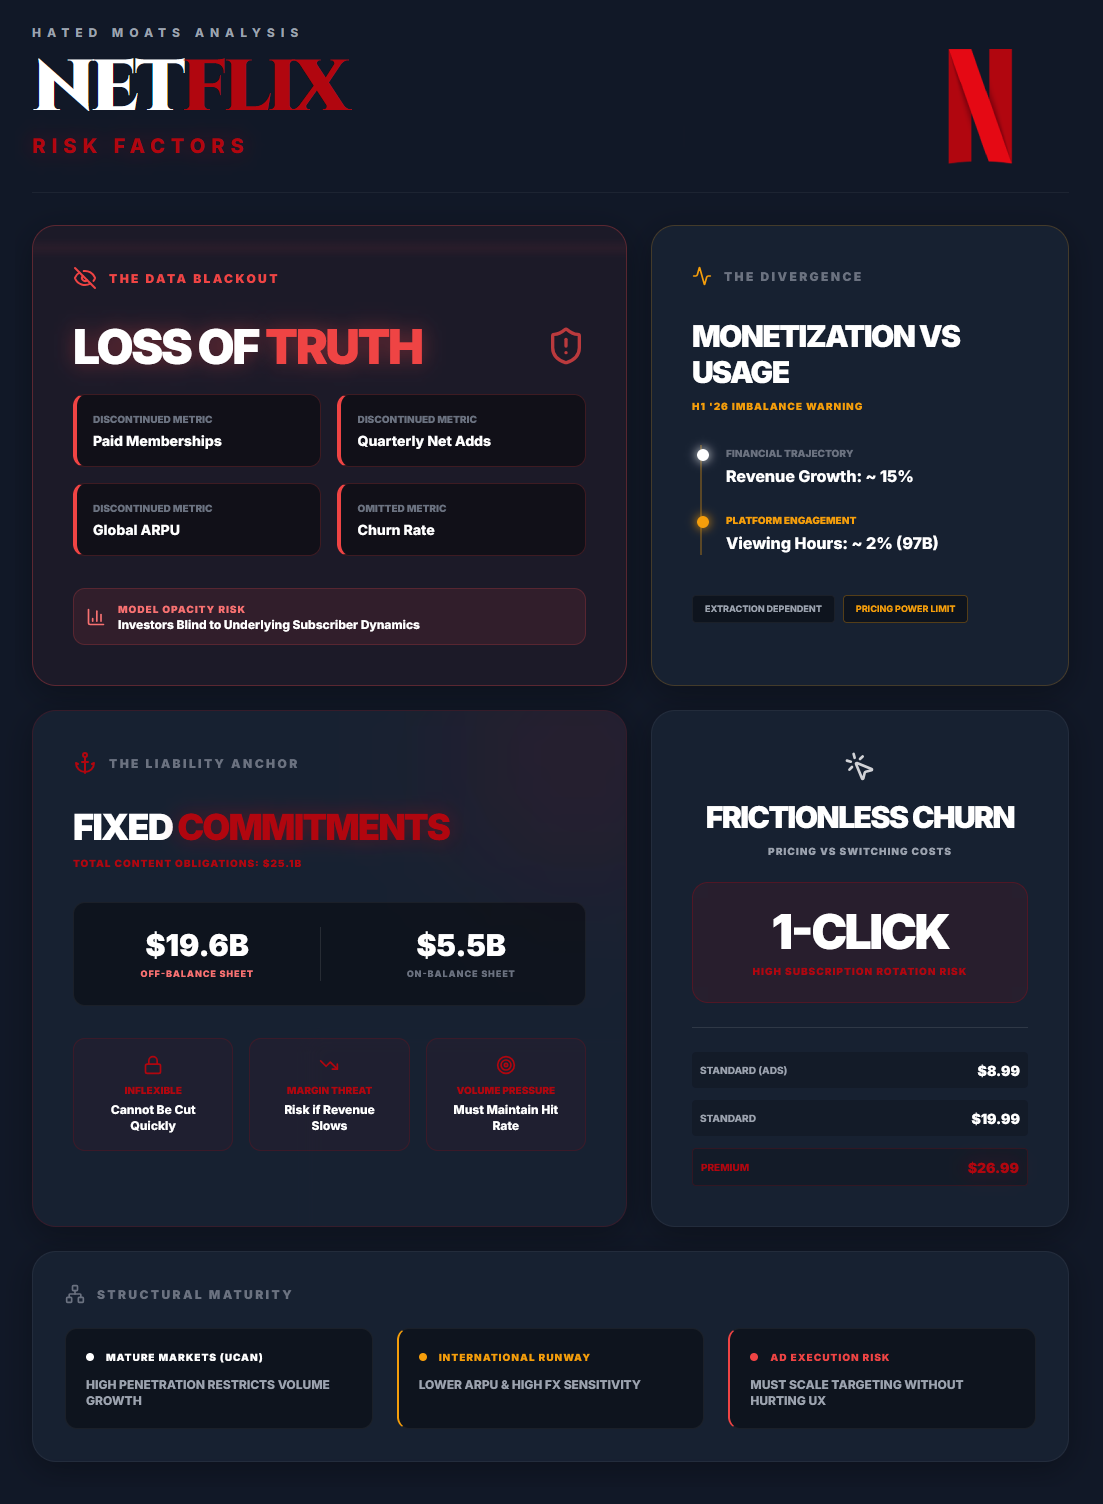
The most probable (and most obious) risk is structural growth deceleration. Netflix has progressively stopped reporting paid memberships, average revenue per membership, quarterly net additions, regional membership figures, churn or average revenue per membership.
The reporting change is understandable because advertising, paid sharing, multiple pricing tiers and extra-member accounts make simple subscriber comparisons less representative of the business. However, it removes the clearest measures of customer growth, retention and price realisation. Investors must now infer customer health primarily from regional revenue, engagement, management commentary and third-party viewing data, so not really from the direct “source of truth”.
Maturity is most relevant in markets where Netflix has operated for many years and penetration is already high. The company acknowledges that membership growth is slower in long-established and highly penetrated countries. International markets provide additional runway, but generally at lower revenue per membership and with greater foreign-exchange sensitivity.
Q2 2026 print doesn’t suggests immediate weakness, but the direction is clear. Sustained single-digit revenue growth would reduce operating leverage, increase the importance of cash yield and make the current valuation more difficult to support.
Pricing, Advertising & Engagement
Netflix’s current US prices are $8.99 per month for Standard with ads, $19.99 for Standard and $26.99 for Premium. Management said that first-half price changes in the US, Mexico and Spain performed consistently with previous increases and internal expectations. This supports the pricing-power thesis, but Netflix remains easy to cancel and repeated increases can encourage subscription rotation when the content slate is weaker.
Advertising is both an opportunity and an execution risk. The company must continue improving targeting, measurement, programmatic access and advertiser demand without degrading the viewing experience or increasing ad load enough to weaken the appeal of the lower-priced plan.
The principal warning signal is the divergence between monetisation and usage (97 billion hours of watchtime in H1 2026, total viewing growing 2%, and revenue growing almost 15%). Price increases, membership growth and advertising can legitimately increase revenue faster than viewing, but more of the financial thesis now depends on extracting additional value from each hour consumed.
The lower “willingness to disclose” also increases the risk that weaker audience momentum becomes visible later than it would have under the previous disclosure schedule.
Content Execution & Fixed Commitments
Content is simultaneously Netflix’s main competitive advantage and its largest economic risk. Of $25.11B in obligations, approximately $19.6B had not yet been recognised as balance-sheet liabilities because the relevant titles hadn’t met the accounting criteria for recognition.
The long-term and largely fixed nature of the company’s commitments limits Netflix’s flexibility. Production contracts, licensing agreements and talent arrangements cannot be reduced immediately if growth disappoints. Cutting the content pipeline too aggressively would also weaken future engagement and retention, creating a lag between cost reductions and damage to the product. Netflix explicitly warns that weaker-than-expected revenue could pressure margins because content obligations cannot be adjusted proportionately in the near term.
The real risk is therefore a sustained decline in content productivity, not just one unsuccessful film or series. Warning signs would include content amortisation or cash spending growing faster than revenue, rising marketing requirements, falling viewing share and fewer titles generating meaningful global engagement.
Live programming, games, video podcasts and creator content add optionality but also increase execution complexity.
Cash Flow, Debt & Accounting
The overall refinancing risk is currently low with net debt of roughly $5.18B. The company has $1B of notes maturing in November 2026 and has stated that it plans to refinance them.
The larger financial risk is the interaction between fixed content commitments and a future operating slowdown. Content obligations exceed funded net debt several times over, and nearly $12B is scheduled for payment within 12 months. These obligations are part of the normal operating model rather than conventional borrowing, but they still reduce Netflix’s ability to respond quickly to weaker cash generation.
Headline 2026 FCF also requires normalisation, as we described above.
Content accounting requires significant management judgement. Netflix amortises content according to estimated viewing patterns and expected useful lives. If actual consumption differs from those estimates, the timing of amortisation can change and current-period expenses may increase. There is no clear evidence of aggressive accounting, but the estimates can create quarterly volatility and should be evaluated alongside cash content payments.
Foreign exchange creates additional variability. Currencies other than the US dollar represented 57% of revenue and 30% of operating expenses during the first half of 2026. Netflix hedges part of its exposure, but the programme reduces rather than eliminates the effect of exchange-rate movements.
Tax exposure is more concrete than a generic regulatory warning. Netflix recognised approximately $619 million of operating expense in 2025 connected with Brazilian non-income-tax assessments. During the first half of 2026, it made $729 million of non-routine payments related to prior-period Brazilian assessments. The amounts are manageable relative to Netflix’s earnings, but demonstrate how country-specific consumption and digital-tax disputes can create material episodic charges.
Competition, Bundling & Technology
Competition should be assessed across total leisure time rather than through narrow streaming-market-share estimates. As discussed in competition section, Netflix competes with Disney, Amazon, Warner Bros. Discovery, Apple and regional streaming platforms, but also with YouTube, TikTok, gaming, podcasts and traditional television. Its rivals may subsidise video through retail memberships, hardware sales, advertising ecosystems, sports rights, theme parks or broader media bundles.
These models can make Netflix’s stand-alone subscription appear expensive even when its absolute value remains strong. Low switching costs allow consumers to rotate services quickly in response to price changes, content releases or attractive bundles. Netflix offsets this through its global catalogue, release frequency and product quality, but those advantages require continuous reinvestment.
Technology dependency is manageable but material. Netflix operates the vast majority of its computing infrastructure on Amazon Web Services (AWS) and states that it cannot easily transfer those operations to another cloud provider. A prolonged AWS outage, commercial dispute or security incident could therefore impair business operations, even though Netflix operates its own Open Connect delivery network for streaming traffic.
AI creates a two-sided risk. It may improve recommendations, advertising, localisation and production efficiency, but it can also reduce competitors’ technology disadvantages, intensify cyber threats and create intellectual-property, labour and regulatory disputes. AI adoption shouldn’t automatically be treated as a moat unless it produces measurable gains in engagement, costs or monetisation.
Regulation, Legal Exposure & Cybersecurity
The EU’s European-content requirement is already in force. On-demand audiovisual services must generally ensure that at least 30% of their catalogues consist of European works and give those works prominence. Member states may also require direct investment in European content or contributions to national production funds, including obligations applied to services established in another member state but targeting local audiences.
The broader risk is the accumulation of country-specific quotas, levies, investment requirements, age-verification rules, censorship restrictions and local production obligations. Individually, most are manageable. Collectively, they can reduce the efficiency of a single global platform and increase the cost of serving smaller markets.
Privacy risk shouldn’t be dismissed either because Netflix collects less social or search data than some technology platforms. Its recommendation and advertising systems use member, device, viewing, demographic, billing and transaction information. Netflix is subject to GDPR, California privacy law and comparable regimes, and restrictions on collection or targeting could weaken personalisation and advertising effectiveness.
Third-party cybersecurity is a demonstrated vulnerability. Netflix states that it and its partners have experienced unauthorised releases of digital content assets and unintended disclosure of personal information due to third-party incidents. None has had a material financial effect to date, but a larger event involving payment information, credentials or unreleased franchise content could create direct losses, regulatory exposure and reputational damage. Netflix also doesn’t carry insurance covering all costs associated with cyber disruption or unauthorised access, which can be rather a big pain in some unfortunate situations.
Capital Allocation & Acquisition Risk
The failed WBD transaction removed the immediate integration and leverage risk, but revealed that Netflix is willing to consider transformative acquisitions. The company agreed to acquire WBD’s streaming and studios businesses, including HBO and HBO Max, at an indicated enterprise value of approximately $82.7B. It arranged substantial financing, including bridge commitments that were increased to $42.2B, alongside a $20B delayed-draw term facility and a $5B revolving facility.
WBD terminated the agreement on February 27, 2026 to enter into a transaction with Paramount Skydance, which paid the $2.8B termination fee to Netflix on WBD’s behalf. The outcome was financially favourable to Netflix, but the attempted acquisition demonstrates that large-scale M&A is now a credible component of the planning and thus of the risk profile as well. Future deals could introduce substantial leverage, integration challenges and regulatory uncertainty.
Share repurchases are the nearer-term allocation risk. Netflix bought back $4.7B of shares during Q2, its largest quarterly repurchase, and retained $27.1B of authorisation. Repurchases have reduced the share count, but purchases made at elevated valuation multiples can destroy value while still increasing reported EPS. The warning sign would be continued aggressive buybacks while normalised FCF, engagement or content productivity deteriorates.
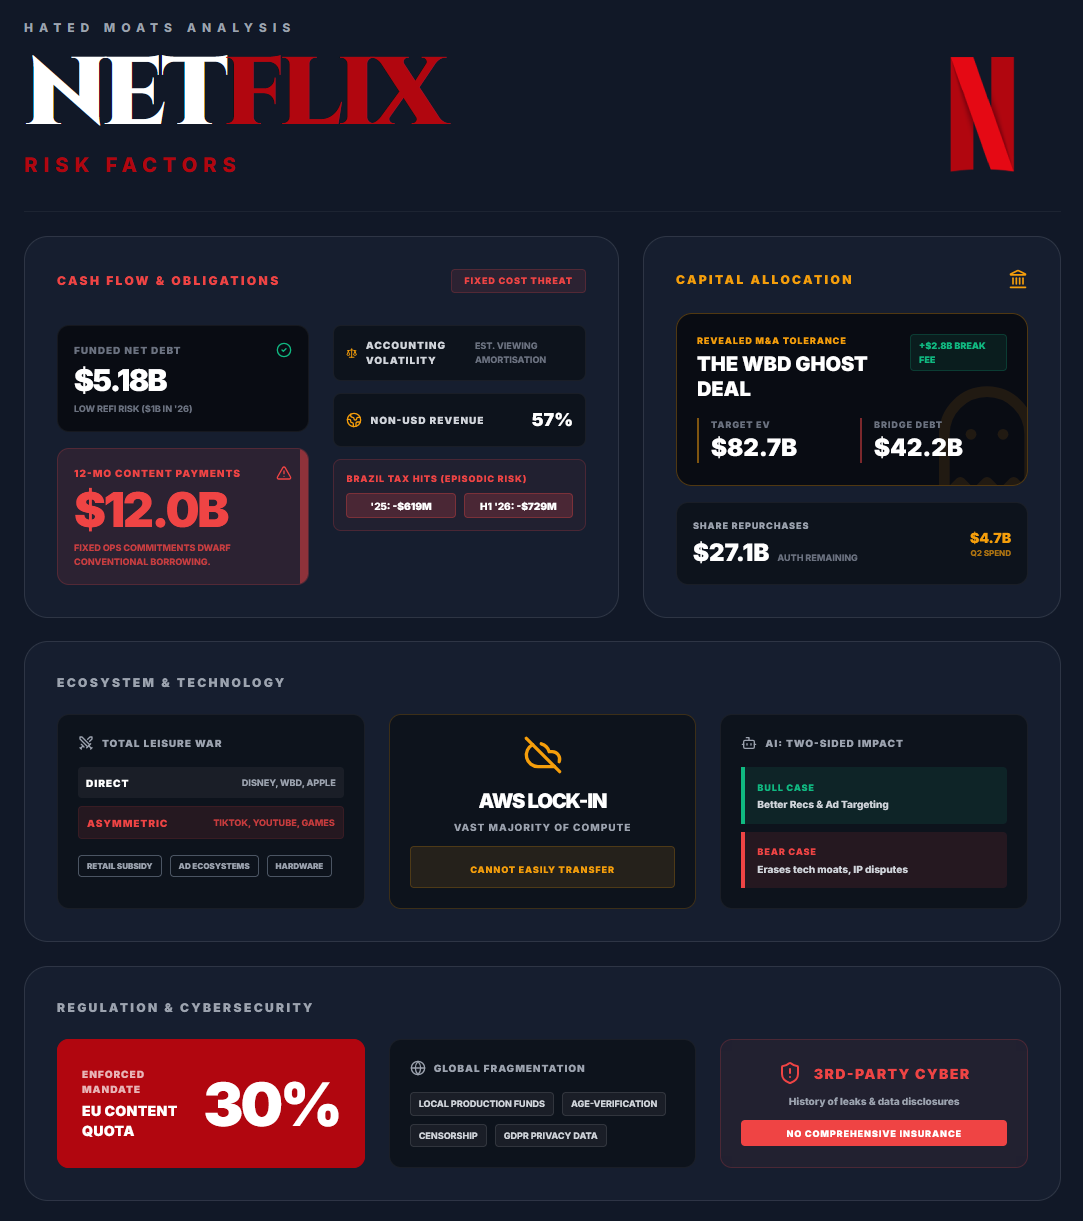
The most likely risk is continued growth deceleration. The highest-impact operating risk is falling engagement that simultaneously weakens pricing power and forces greater content spending. We believe the most underappreciated risk is reduced KPI visibility. Without regular memberships, average revenue per membership or churn disclosure, deterioration may become apparent later than it did under the previous reporting framework.
In our view, the clearest thesis breakers would be several quarters of single-digit revenue growth combined with falling operating margins, advertising materially missing expectations, or cash content spending rising while engagement contracts.
Netflix remains financially resilient, but the business still requires continuous proof that content investment produces sufficient engagement to support higher monetisation.
Our Scenarios (3-5 Year Horizon): Bull, Base, Bear Case
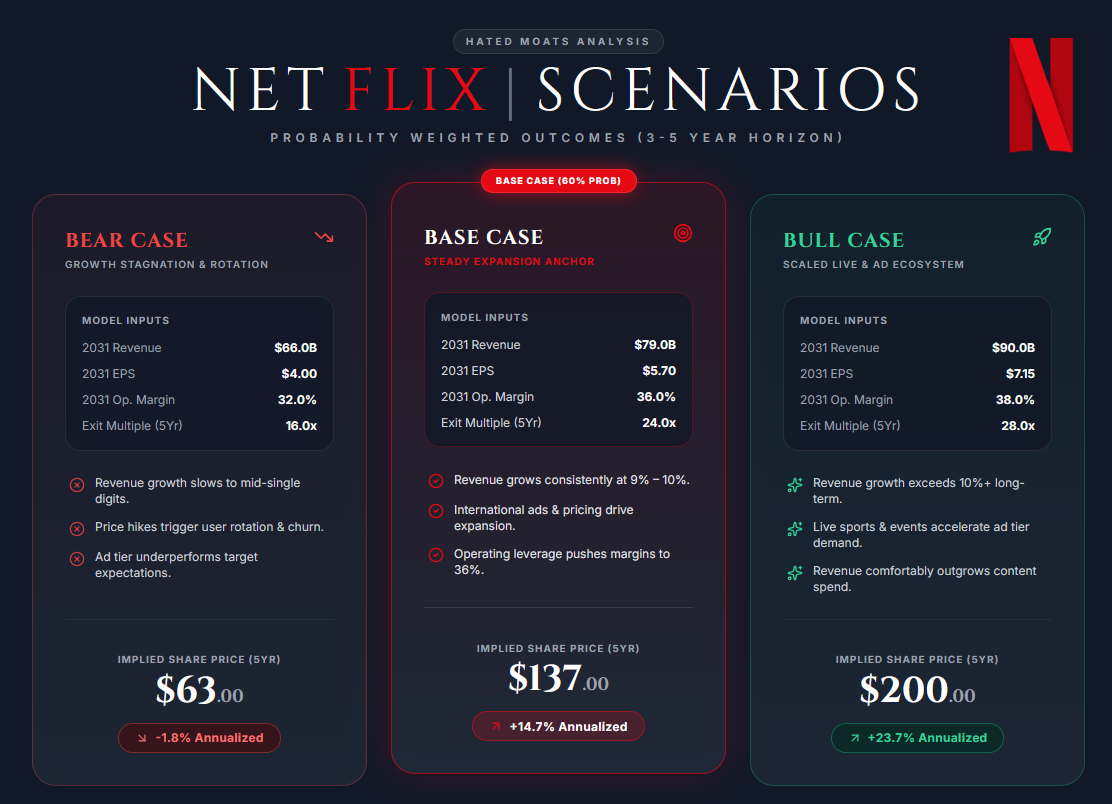
We use a 3-to-5-year horizon to assess how Netflix’s revenue growth, advertising business, margins and content economics could develop by 2029 and 2031. Unlike our DCF cited above, which estimates intrinsic value today, the figures below represent potential future share prices if each operating scenario materialises. The DCF provides the underlying financial framework, while future values are based on normalised horizon-year earnings and scenario-appropriate valuation multiples.
Bull Case (20% Probability)
Key Assumptions
Netflix maintains revenue growth above 10% through 2031 as advertising, pricing and international monetisation develop better than expected. Engagement improves, live programming supports acquisition and advertising demand, and revenue continues to outgrow content spending. Operating margin reaches approximately 36% in 2029 and 38% in 2031.
Financial Outcomes
Revenue reaches approximately $74B in 2029 and $90B in 2031, producing normalised EPS of roughly $5.30 and $7.15. Applying earnings multiples of 30x and 28x produces estimated share prices of $160 in 3 years and $200 in 5 years.
From the $69 reference price, that represents annualised returns of approximately 32.4% over 3 years and 23.7% over 5 years.
Base Case (60% Probability)
Key Assumptions
Growth gradually moderates as paid-sharing benefits normalise and mature markets become more penetrated. Pricing, advertising and international expansion keep revenue growing near 9% to 10%, while content productivity remains healthy. Operating leverage continues, taking margins to approximately 34% in 2029 and 36% in 2031.
Financial Outcomes
Revenue reaches approximately $68B in 2029 and $79B in 2031, producing normalised EPS of roughly $4.60 and $5.70. Applying earnings multiples of 25x and 24x produces estimated share prices of $115 in 3 years and $137 in 5 years.
From the $69 reference price, that represents annualised returns of approximately 18.6% over 3 years and 14.7% over 5 years.
Bear Case (20% Probability)
Key Assumptions
Revenue growth falls towards the mid-single digits as engagement remains weak, price increases encourage subscription rotation and advertising underperforms expectations. Netflix must maintain elevated content and marketing investment, limiting margin expansion. Operating margin reaches only approximately 31% in 2029 and 32% in 2031.
Financial Outcomes
Revenue reaches approximately $61B in 2029 and $66B in 2031, producing normalised EPS of roughly $3.50 and $4.00. Applying earnings multiples of 17x and 16x produces estimated share prices of $60 in 3 years and $63 in 5 years.
From the $69 reference price, that represents annualised returns of approximately negative 4.6% over 3 years and -1.8% over 5 years.
Moat Resilience Index™ (MRI)
Moat Strength: 6.5/10
Netflix’s moat rests on global scale, brand recognition, content breadth, proprietary viewing data and industry-leading streaming economics. Its worldwide audience allows content and technology costs to be spread across a larger revenue base than most competitors can achieve.
The score stops at 6.5 because switching costs are low, content must be continuously replenished and stronger rivals possess valuable franchises, bundles or wider technology ecosystems.
Moat Hate: 7/10
Netflix has suffered a severe valuation reset despite continued double-digit revenue growth, operating margins above 30% and strong cash generation. Investors are increasingly concerned about slowing growth, modest engagement gains, reduced disclosure and dependence on advertising and pricing.
Sentiment is clearly weak, with the market treating deceleration as evidence that Netflix is becoming a mature media company rather than a structurally superior compounder.
Moat Vulnerability: 6/10
Netflix remains the global streaming leader, but customers can cancel or rotate subscriptions with little friction. YouTube, TikTok, Disney, Amazon and bundled platforms compete for the same limited pool of leisure time and can operate under different economic incentives.
The main risk is gradual erosion of engagement and pricing power, forcing Netflix to spend more on content and marketing merely to preserve its current position.
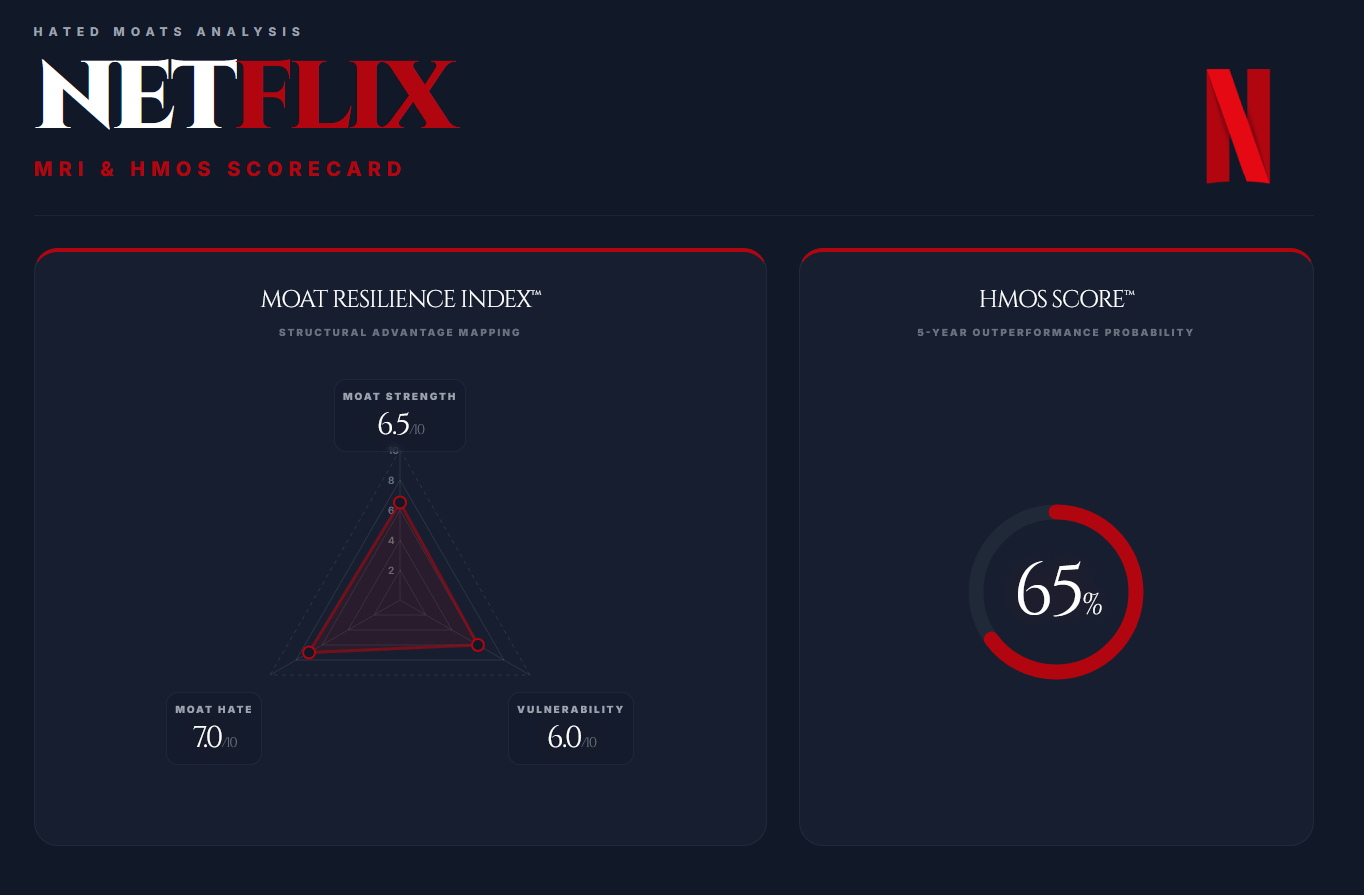
Hated Moats Outperformance Score™ (HMOS): 65%
Netflix receives an HMOS of 65/100, indicating a moderately favourable 5-year outperformance set-up rather than a statistically derived probability.
The opportunity rests on continued double-digit revenue growth, advertising expansion, pricing power, margin resilience and disciplined content spending. The principal risks are weaker engagement, faster growth deceleration, rising content costs, (even more) reduced disclosure and value-destructive buybacks or acquisitions.
Conclusion
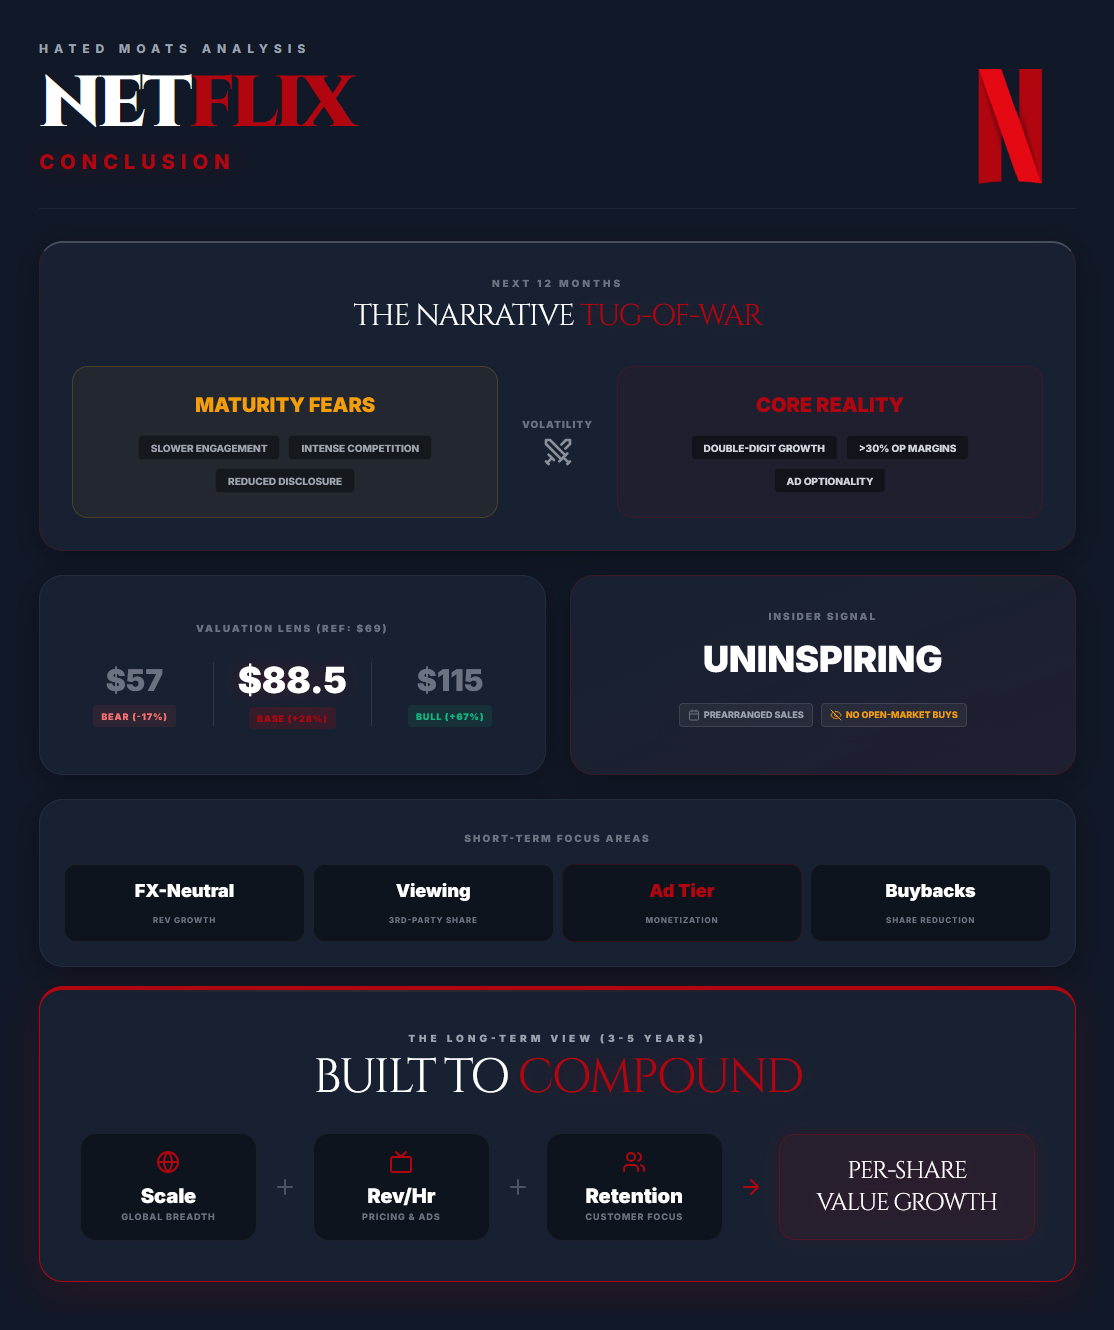
Netflix remains caught between two narratives. On one hand, it is the world’s leading streaming platform, with double-digit revenue growth, operating margins above 30%, strong cash generation and expanding advertising optionality. On the other hand, it is a more mature business facing slower engagement growth, reduced disclosure, rising monetisation dependence and intense competition for consumer attention. Near-term volatility is therefore likely to continue.
The long-term case rests on Netflix’s global scale, content breadth, recommendation systems and ability to monetise its audience through pricing, advertising and selective live programming. It doesn’t need viewing hours to grow as quickly as revenue indefinitely, but it must continue improving revenue per hour without damaging retention or weakening the customer experience.
The main risk is that engagement remains subdued while pricing, advertising load and content spending rise. In that outcome, Netflix could still grow revenue, but the quality and durability of that growth would deteriorate. Competition from YouTube, TikTok, bundled streaming platforms and subsidised technology ecosystems makes this more than a traditional media contest.
At the $69 reference price, our $88.50 base-case DCF value implies approximately 28% upside, while the $115 bull case implies almost 67%. The $57 bear case suggests roughly 17% downside, although outcomes could be worse if growth falls into the single digits, margins contract or content productivity weakens materially.
Management deserves credit for responding effectively to the 2022 slowdown. This is not the first rodeo of being a Hated Moat for Netflix. Paid sharing, advertising, pricing and tighter expense control have materially improved revenue growth, margins and FCF. The decision not to increase the WBD offer also showed valuation discipline. However, the attempted transaction confirms that transformative acquisitions are now a credible capital-allocation strategy as well as risk.
Insider activity provides little positive confirmation. Recent executive sales were largely connected with prearranged plans, vesting and diversification, but no meaningful discretionary open-market purchases were identified. And personally, we miss those at these levels. The signal isn’t decisively bearish, but neither does it strengthen the investment case.
We believe investors should focus on regional and FX-neutral revenue growth, engagement and third-party viewing share, advertising revenue, cash content spending relative to amortisation, operating margins, normalised FCF and actual share-count reduction.
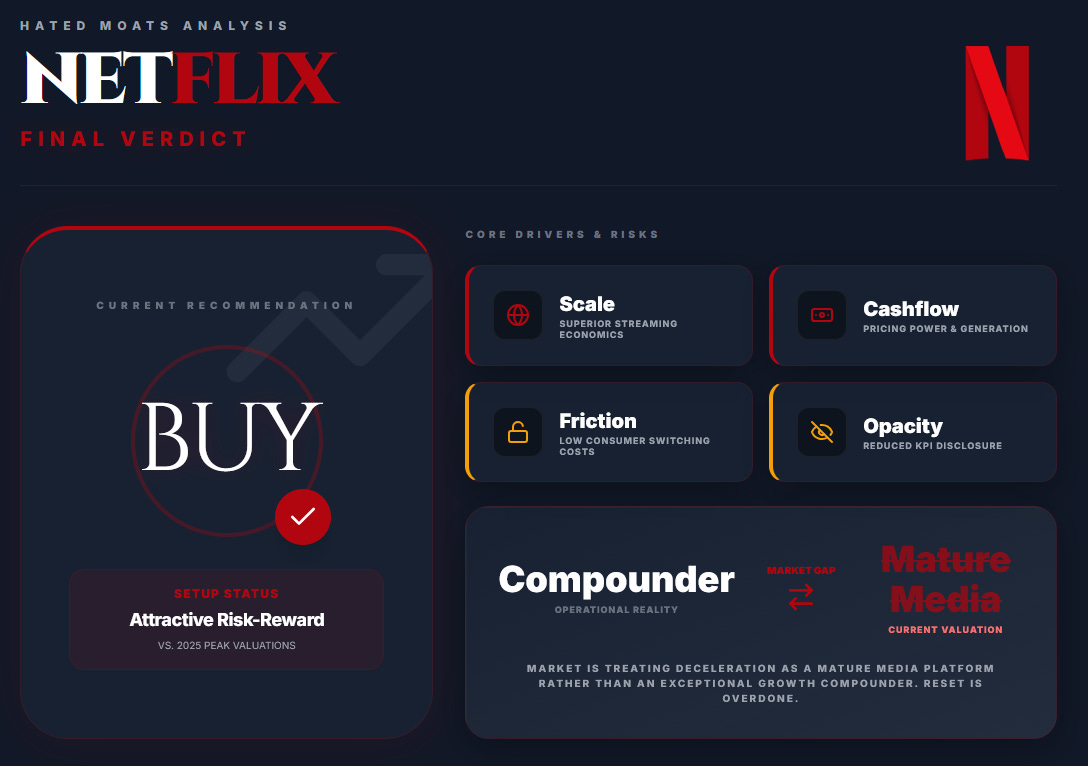
Final Verdict: BUY
Netflix qualifies as a Buy, although not a Strong Buy. Its global scale, superior streaming economics, pricing power and cash generation support a favourable 3-to-5-year outlook. The recent valuation reset has created a more attractive risk-reward profile than existed near the 2025 peak.
Our conviction is limited by modest engagement growth, low switching costs, reduced customer disclosure and a valuation that still assumes sustained double-digit growth and margins above 30%. Advertising must become a durable profit contributor, while content spending must remain controlled without weakening the platform.
The decision to stop regularly reporting memberships, net additions and average revenue per membership is also a meaningful concern - objectively, and particularly heavy for us subjectively as well. Revenue and operating income are the correct ultimate measures, but the reduced disclosure makes it harder to distinguish healthy monetisation from weakening customer growth or retention.
Our verdict remains BUY, and Netflix appears attractive for investors who believe the base case is achievable. The market is beginning to value the company as a mature media platform rather than an exceptional growth compounder. We believe that reset has gone somewhat too far, but Netflix must now prove that advertising, pricing and content productivity can sustain its financial trajectory as audience growth matures.
Disclaimer & Our Investment
The author of this report does hold a position in the security of Netflix, Inc. This report is for informational purposes only and does not constitute investment advice or a recommendation to buy or sell any security.
Recently I've been wondering about all the guys publishing two "deep dives" a week and wondered how it's humanly possible. :) thanks a lot, appreciate it!
Great article man, I liked how you made your own images for all the data to showcase. I did the same in my article.
And it's definitely in a good accumulation period as a zone, but people can still wait before buying heavily, I wrote it in my article. But man, I loved the images though. I think netflix can prove its growth components which can be seen in their actions, like not disclosing subscribers count from earlier this year. So, they can focus on pricing & retention per subscriber. Opening Netflix house. Buying & working with AI productions rather than burning cash for their own, etc.