
ServiceNow: DCF Valuation
ServiceNow is experiencing the SaaS carnage of 2025/26 in full scale. Does it offer a good value play? - DCFriday #010

Date of Analysis: Febuary 17-20, 2026
Verdict: Undervalued
Current Price Target (Base Case): $160
Price at the Time of Analysing: $104.27
1. Brief Overview
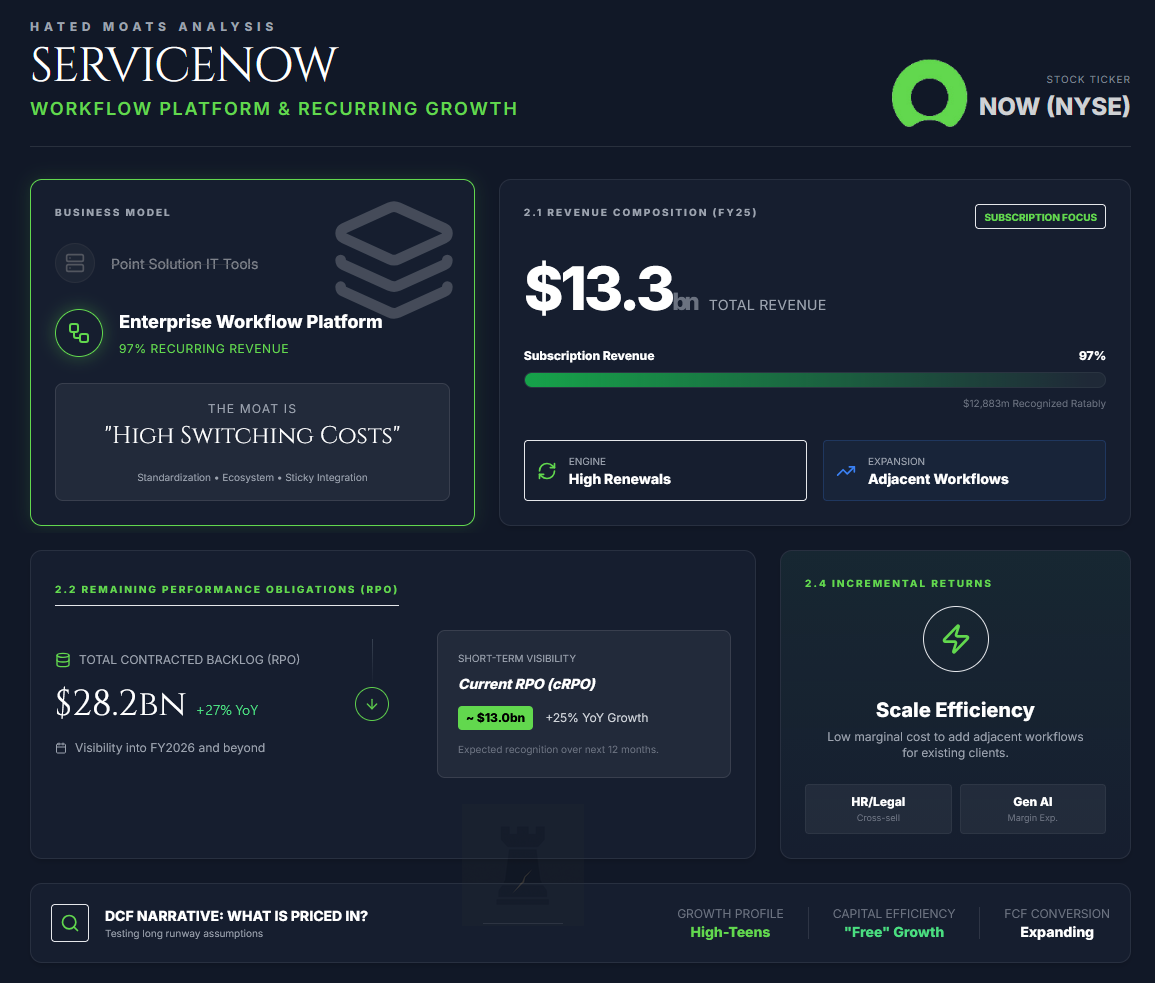
ServiceNow ( NOW 0.00%↑ ) sells a cloud software platform that standardises and automates “work” inside large organisations. Historically the company served IT service management, now broadened into enterprise service management and workflow automation across functions. The economic engine is recurring subscription revenue recognised primarily ratably over contract terms for cloud-based offerings (with a minority recognised upfront for self-hosted software), supported by a large installed base, high renewal rates, and expanding use-cases. In FY2025, subscription revenue was $12,883m out of $13,278m total (97% of revenue). For cloud-based offerings, subscription revenue is recognised over time as customers receive access to the subscription services and related support, anchoring predictability and giving backlog metrics real forecasting value.
ServiceNow discloses remaining performance obligations (RPO) as contracted, non-cancellable, not-yet-recognised revenue (with exclusions such as billed-in-arrears contracts under the right-to-invoice practical expedient and the upfront revenue element of self-hosted offerings), and current RPO (cRPO) as the portion expected to be recognised over the next 12 months. As of 31 Dec 2025, RPO was $28.2bn, with 46% classified as cRPO. RPO and cRPO grew 27% and 25% YoY, respectively. That’s a strong evidence of demand visibility into FY2026 even if growth decelerates.
The most relevant to a DCF is the combination of workflow standardisation (high switching costs once embedded in processes), an ecosystem of integrations/partners, and a platform model that reduces marginal cost of adding adjacent workflows for the same customer (supporting high incremental returns if reinvestment is disciplined). This valuation explicitly tests what the market appears to be pricing in, i.e. a long runway of high-teens growth with expanding margins and very efficient reinvestment such that growth is close to “free” in cash flow terms.
So without further ado, let’s look at our DCF model…
2. Discounted Cash Flow (DCF): Assumptions & Methodology
All per-share figures below are split-adjusted for ServiceNow’s 5-for-1 stock split (effective mid-December 2025). Base year (FY2025) total revenue is $13.28B.
We value ServiceNow (NOW) using a 10-year unlevered Free Cash Flow to the Firm (FCFF) model discounted at WACC, plus a perpetuity terminal value beyond Year 10. The model is unlevered to isolate operating performance from financing decisions. The framework is indexed. FY2025 revenue is set to 100, and the forecast is built in percentage terms before converting back to USD using the $13.28B base.
2.1 Revenue Forecast (Years 1-10)
ServiceNow is sitting (as many SaaS companies are) at a crossroads, a collision point between two narratives. One is “AI disrupts SaaS, putting pressure on seats” (i.e., bear case of fewer human users, pricing pressure). The other is “AI makes workflow platforms more valuable” (i.e., base case of more automation use-cases, higher attach, deeper entrenchment). Our base case leans to the second narrative, but we force conservatism through a disciplined growth fade and cash-flow mechanics.
Year 1 (FY2026)
Growth is anchored to management’s FY2026 subscription revenue outlook of $15.53-$15.57B and the durability implied by remaining performance obligations / cRPO, with total revenue assumed to grow broadly in-line given the subscription mix. We model 20.5% total revenue growth in FY2026, broadly in line with the company’s FY2026 GAAP subscription revenue growth guidance of 20.5% to 21%.
Years 2-5 (FY2027-FY2030)
We assume a fade from 18.0% to 14.0%. This assumes “land and expand” remains intact, AI-driven workflow adoption increases wallet share, and the platform continues expanding beyond core ITSM into broader enterprise workflows, while recognising that RPO/cRPO primarily supports near-term revenue conversion rather than several years of growth. We do not assume indefinite >15% growth. We explicitly compress duration as the revenue base scales (considering company’s maturation, market’s saturation, and the law of large numbers).
Years 6-10 (FY2031-FY2035)
We assume a fade from 12.0% to 4.5% here. This converges toward a mature “GDP+” compounder profile, reflecting a transition from hyper-growth to an enterprise utility with durable renewal economics and incremental pricing power, albeit with slower unit expansion.
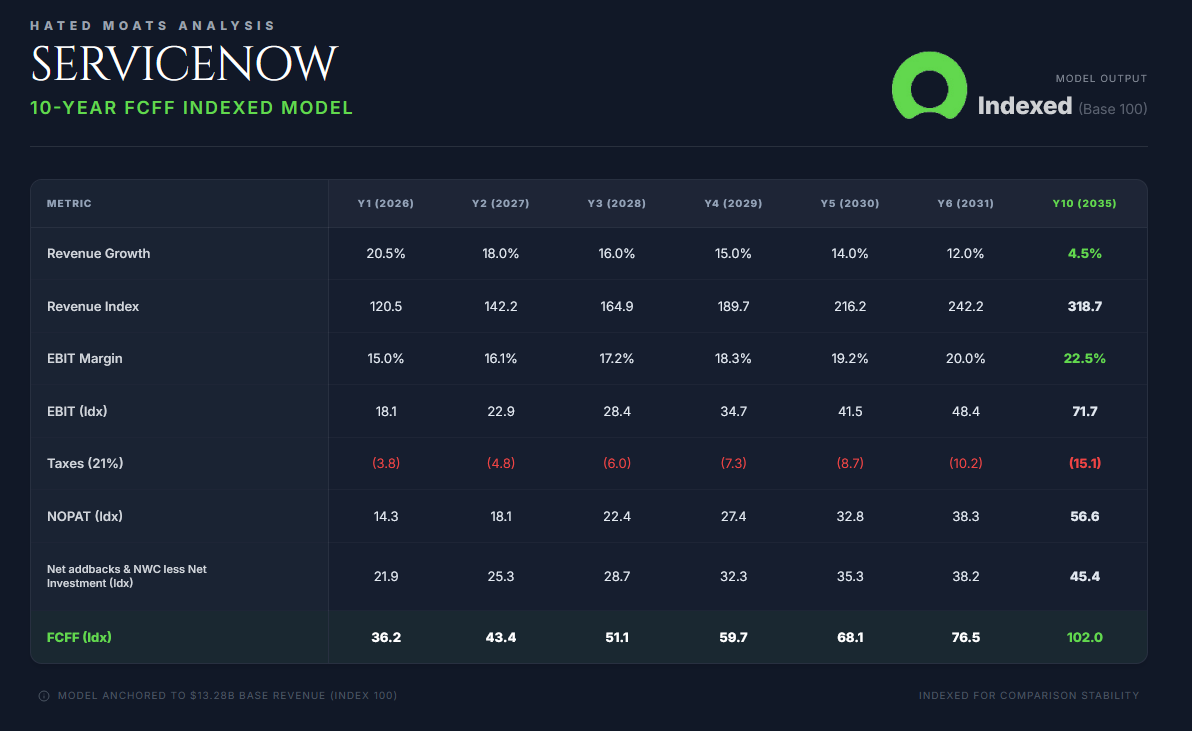
Exact revenue growth path used in our methodology:
Year 1 (2026): 20.5%
Year 2 (2027): 18.0%
Year 3 (2028): 16.0%
Year 4 (2029): 15.0%
Year 5 (2030): 14.0%
Year 6 (2031): 12.0%
Year 7 (2032): 10.0%
Year 8 (2033): 8.0%
Year 9 (2034): 6.0%
Year 10 (2035): 4.5%
2.2 Profitability (EBIT → NOPAT)
We anchor profitability on GAAP operating income (EBIT) to fully capture the economic cost of stock-based compensation (SBC, which is significant) in the income statement. FY2026 GAAP operating margin guidance is 15%, and FY2025 GAAP operating margin was in the low-teens. We start our model at 15.0% in FY2026 in-line with guidance.
We then expand GAAP EBIT margin gradually to 22.5% by FY2035. The drivers are operating leverage (especially in sales and marketing as renewals and expansions scale), ongoing mix benefits from higher-value workflows, and gradual SBC dilution of revenue as a percentage over time, partially offset by continued AI and platform investment.
We apply a normalised operating tax rate of 21% across the explicit period for NOPAT modelling. This is a simplifying assumption designed for stability. Actual cash taxes may be lower in some years due to tax attributes, but the DCF should not rely on transitory tax shields for “alpha”.
NOPAT = EBIT x (1 - 21%).
2.3 Reinvestment & Working Capital & SBC Consistency
A common modelling error in high-quality software is projecting high growth and high margins while also assuming near-100% free cash flow conversion without the working capital and non-cash addback mechanics that actually drive SaaS cash generation. We’d like to avoid this mistake.
To keep the model institutionally consistent with how ServiceNow converts earnings into cash, we treat:
SBC as a real expense in EBIT/NOPAT (conservative profitability), but we add SBC back in FCFF as a non-cash charge and then address dilution at the per-share level via a “net dilution offset by buybacks” assumption. This is consistent with ServiceNow’s stated buyback intent to manage dilution, including the incremental $5B repurchase authorisation announced in January 2026.
Non-cash addbacks that have historically mattered for ServiceNow’s cash conversion, including depreciation and amortisation (D&A) and amortisation of deferred commissions; the model also treats the cash investment in capitalised commissions (the change in deferred commissions) as a reinvestment item so we do not overstate FCFF by adding back amortisation without funding it.
Working capital as structurally favourable in the high-growth phase (upfront billing and contract liabilities), but fading toward neutral as growth slows. We model a working-capital inflow that is meaningful early (as a function of revenue growth) and steadily tapers toward 0 by the terminal year.
Capex is modelled at 6-6.5% of revenue near term, consistent with management’s FY2026 outlook for purchases of property and equipment at roughly 6% of revenue, fading modestly as the infrastructure footprint scales.
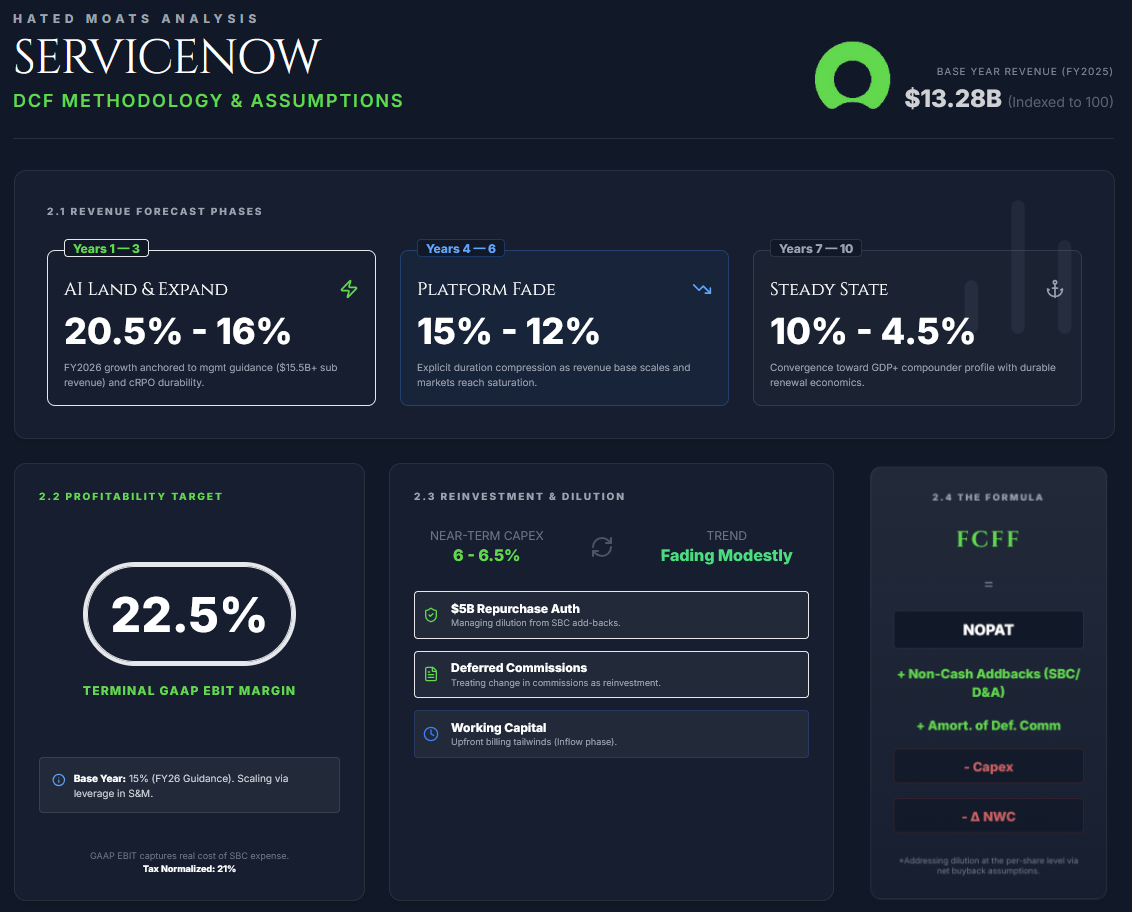
2.4 Free Cash Flow to the Firm (FCFF)
We compute unlevered FCFF as:
FCFF = NOPAT + SBC + D&A + amortisation of deferred commissions - Capex - ΔNWC, where ΔNWC is defined broadly as the net change in operating assets and liabilities, including the change in deferred commissions (capitalised contract acquisition costs) and contract liabilities/deferred revenue.
We do not adjust for interest expense, as the model is unlevered by construction. We add back SBC and other non-cash charges for cash consistency, and we explicitly include changes in operating assets and liabilities (ΔNWC, including deferred commissions and contract liabilities) as a fading source of cash rather than treating it as a permanent free lunch. We believe this builds a sound and robust model.
Per-share values assume buybacks broadly offset net SBC dilution over time (i.e., share count is approximately stable), which aligns with the company’s stated repurchase objective and expanded authorisation.
2.5 Discount Rate (WACC)
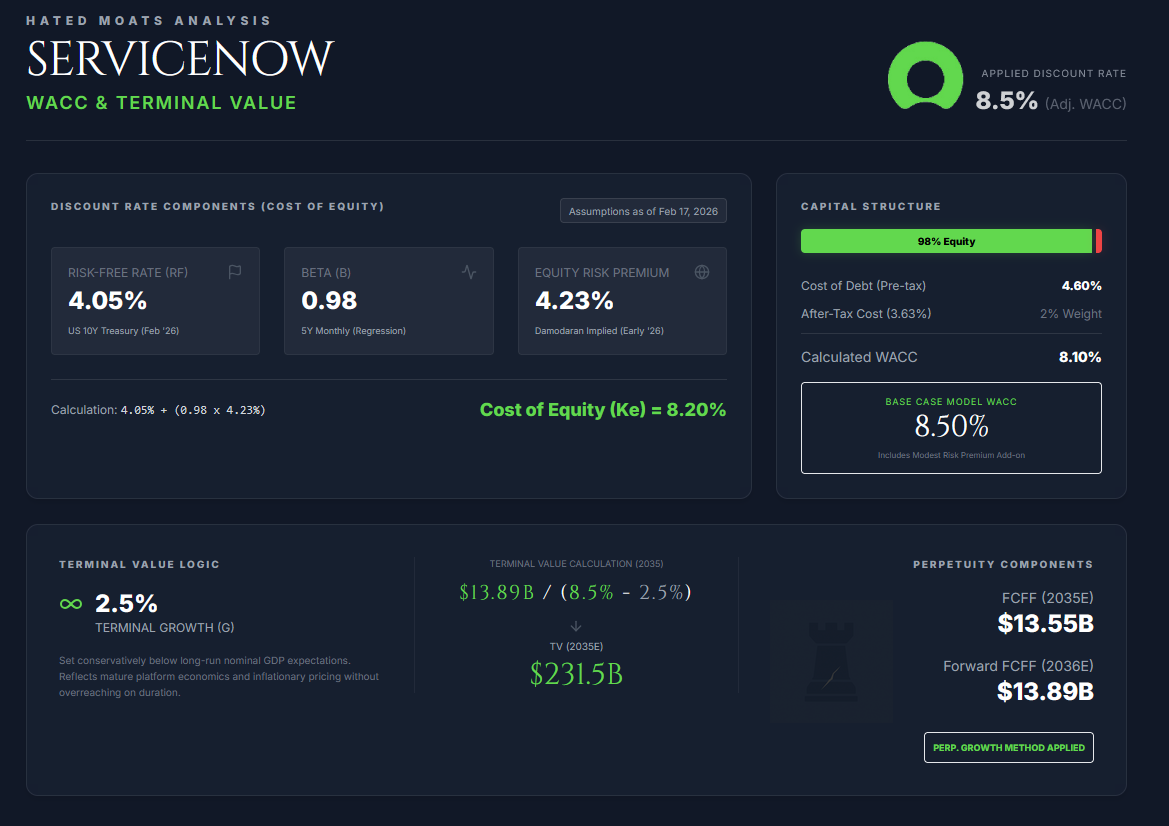
We construct WACC as of February 17, 2026.
Risk-free rate (Rf): 4.05% (US 10Y, 4.05% on Feb 17, 2026).
Equity risk premium (ERP): 4.23% (Damodaran implied ERP, early 2026).
Beta (5Y monthly): 0.98
Cost of equity (Ke) = 4.05% + 0.98 x 4.23% = 8.20%.
Cost of debt (Kd): 4.6% pre-tax, proxied by A-rated corporate yields (ServiceNow is investment-grade and lightly levered).
After-tax cost of debt = 4.6% x (1 − 21%) = 3.63%.
Capital structure weights: given minimal net debt currently, we use 98% equity / 2% debt.
WACC = (0.98 x 8.20%) + (0.02 x 3.63%) = 8.1%
For valuation conservatism (duration sensitivity), our base-case discount rate used in the DCF is 8.5% (i.e., we add a modest risk premium above the mathematical 8.1% to reflect execution risk, AI business-model uncertainty, and acquisition/financing optionality). This is the rate used in the Results section below.
2.6 Terminal Value
We calculate terminal value using the perpetuity growth method.
Terminal Growth Rate assumed (g): 2.5%
This sits below long-run nominal GDP expectations and reflects mature platform economics (pricing roughly inflationary, modest volume growth), while avoiding the overreach of “premium terminal growth” in a high-duration asset. This keeps the model grounded and fairly conservative.
TV(2035E) = FCFF(2036E) / (WACC - g), where FCFF(2036E) = FCFF(2035E) x (1 + g).
Using FCFF(2035E) = $13.55B, WACC = 8.5%, g = 2.5%:
FCFF(2036E) = 13.55 x 1.025 = $13.89B
TV(2035E) = 13.89 / (0.085 - 0.025) = $231.5B
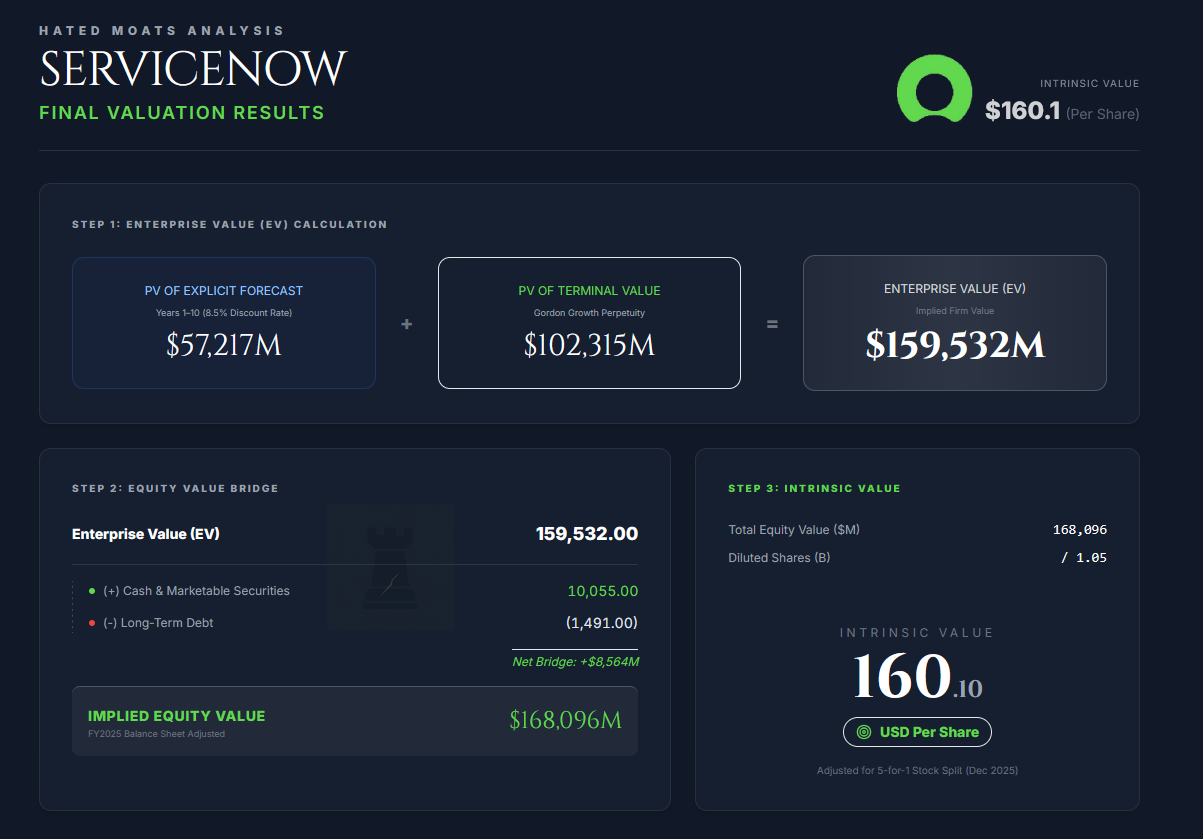
3. Results
All figures below are in $ millions.
PV of FCFF (Years 1-10), discounted at 8.5%: $57,217M
PV of Terminal Value: $102,315M
Enterprise Value (EV) = $159,532M
Equity Value Bridge (latest reported balance sheet, FY2025):
Enterprise Value: $159,532M
+ Cash, cash equivalents and marketable securities: $10,055M
- Long-term debt: $1,491M
Implied Equity Value: $168,096M
Intrinsic value per share:
Assumed diluted shares: 1.05B (split-adjusted, guided/consistent with recent reporting).
Intrinsic value = $168,096M / 1.05B = $160.1 per share
Interpretation
At $104.29/share (Feb 20, 2026 close price), the market is discounting either a) a materially higher long-run discount rate than 8.5%, and/or b) structurally lower steady-state GAAP margins (or weaker cash conversion) than our base case, and/or c) a growth fade that accelerates faster than our explicit path.
4. Scenarios
Bear Case: $98.5/share
Inputs:
WACC 10.0%, terminal g 2.0%. Revenue growth fades faster (AI & seat pressure, weaker net expansion). GAAP EBIT margin caps around 18% by FY2035. Working-capital cash benefit fades earlier and more sharply.
Outcome:
This implies -5.5% downside from the current price.
Base Case: $160/share
WACC 8.5%, terminal g 2.5%. Revenue growth path as listed (20.5% fading to 4.5%). GAAP EBIT margin expands from 15% to 22.5%. Working-capital inflow fades steadily toward neutral. SBC is treated as a real cost in EBIT/NOPAT but added back in FCFF, with buybacks assumed to broadly offset net dilution over time (supported by the expanded repurchase authorisation).
This implies +53.45% upside to the current price.
Bull Case: $199/share
Inputs:
WACC 8.0%, terminal g 3.0%. Growth persists modestly longer (AI-driven workflow proliferation, attach expansion). GAAP EBIT margin expands toward 24% by FY2035 as scale benefits compound and SBC intensity declines. Working capital remains a modest tailwind for longer period of time.
Outcome:
This implies upside +90.85% from the current price.
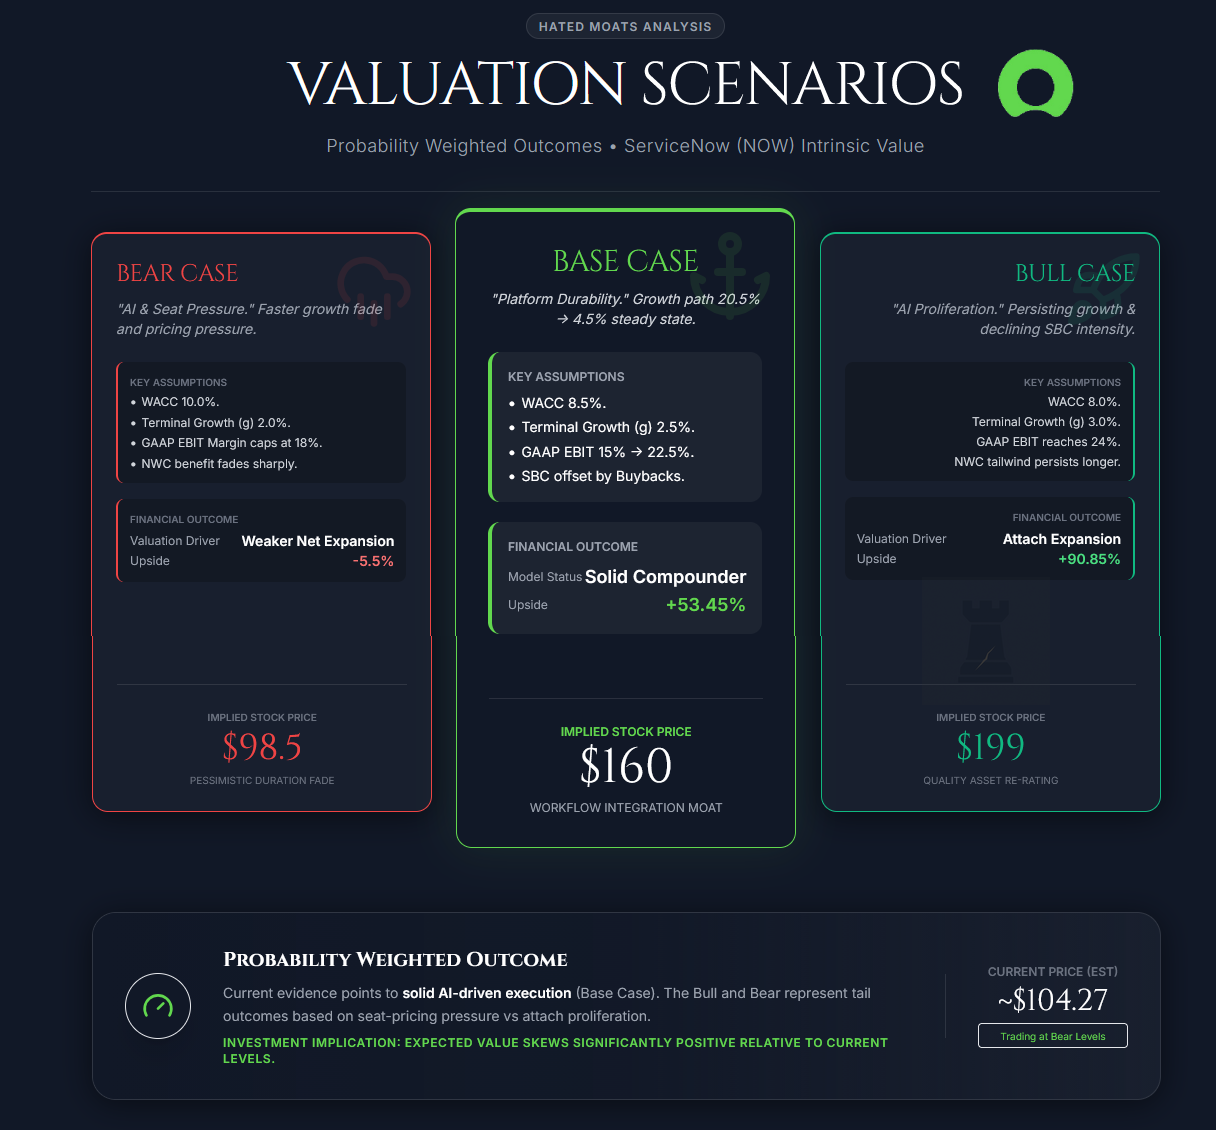
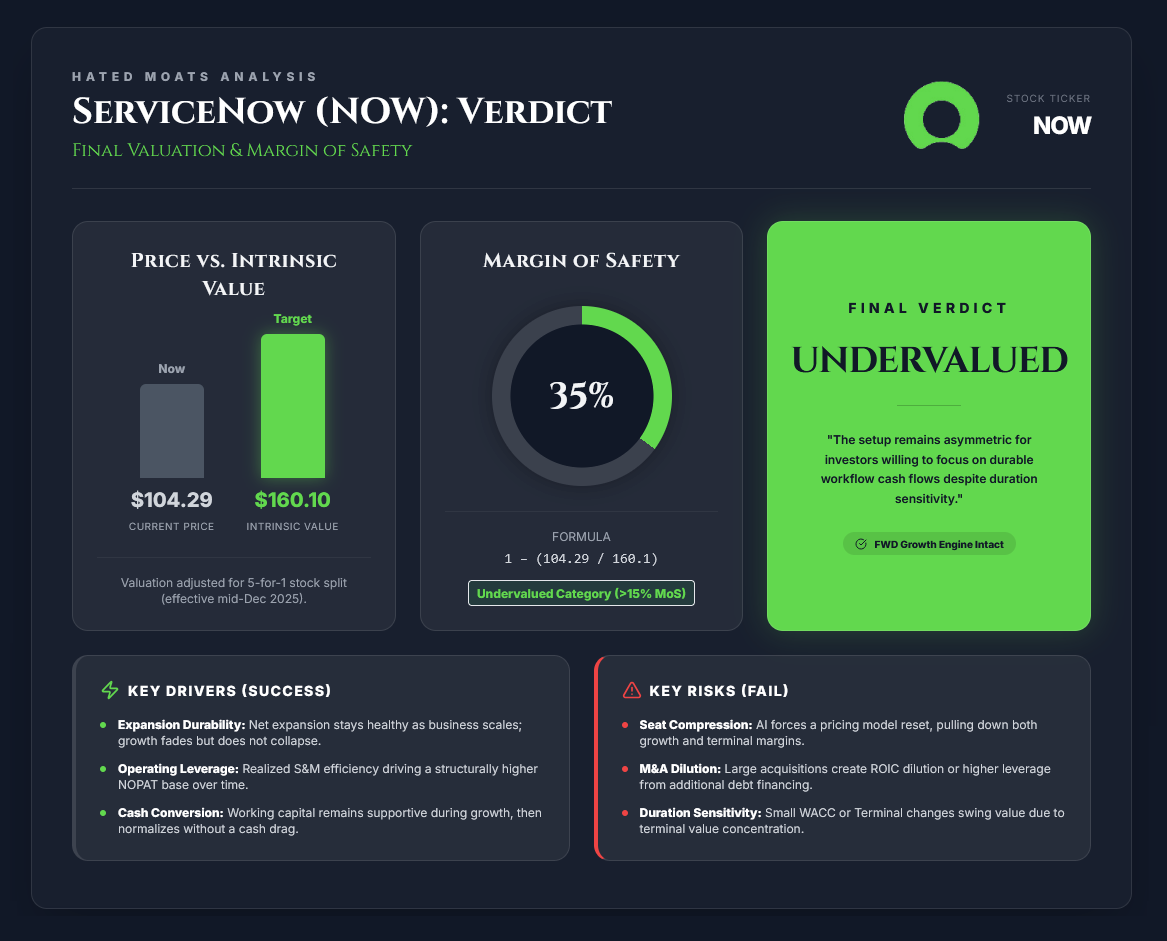
5. Conclusion: Margin of Safety & Final Verdict
Margin of Safety = 1 − (Current Price / Intrinsic Value)
MoS = 1 − (104.29 / 160.1) = 34.86%
On these assumptions, ServiceNow screens as undervalued with a 35% margin of safety to our conservative base-case intrinsic value.
Final verdict: Undervalued (Intrinsic Value = $160)
6. Appendix
6.1. Key drivers (what must go right):
Renewal and expansion durability holds (net expansion stays healthy even as the business scales), so growth fades but does not collapse. GAAP operating leverage is realised over time (especially S&M efficiency), driving a structurally higher NOPAT base. Also, cash conversion remains strong (working capital remains supportive in the growth phase, then normalises without flipping into a persistent cash drag).
6.2. Key risks (what breaks the model):
AI-driven “seat compression” forces a pricing model reset (bad mix shift, weaker monetisation), pulling down both growth and terminal margins. Acquisition and financing optionality (e.g., large M&A like Armis) creates ROIC dilution and/or higher leverage. The company has explicitly noted it may seek additional debt financing for acquisitions. Lastly, if duration sensitivity remains extreme - small changes in WACC or terminal assumptions can swing intrinsic value meaningfully because terminal value still contributes a majority of EV.
Disclosure
The author of this article does not hold a position in the security of ServiceNow, Inc. at the time of publishing this valuation. This article is for informational purposes only and does not constitute investment advice or a recommendation to buy or sell any security.
This is a wonderful analysis, I would like to know your thoughts on Salesforce too
Sent to my friend who is not on here, $NOW is his largest holding by far, might cheer him up a bit....